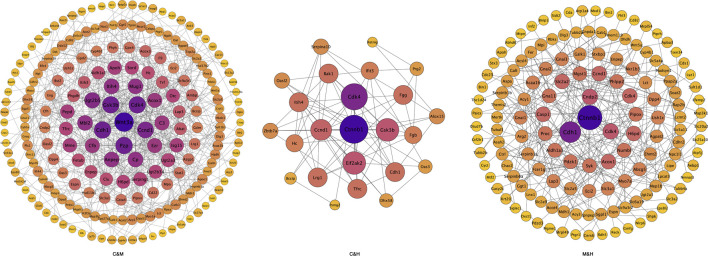
FIGURE 9.
Protein–protein interactions network diagram. Each node in the interaction network represents a protein, the size of the node indicates the number of proteins interacting with it, with larger node indicating more proteins interacting with it, and the color of the node indicates the expression level of the protein, with darker colors indicating higher expression levels. C: normal control; M: model control; H: HQT control, n = 3.

