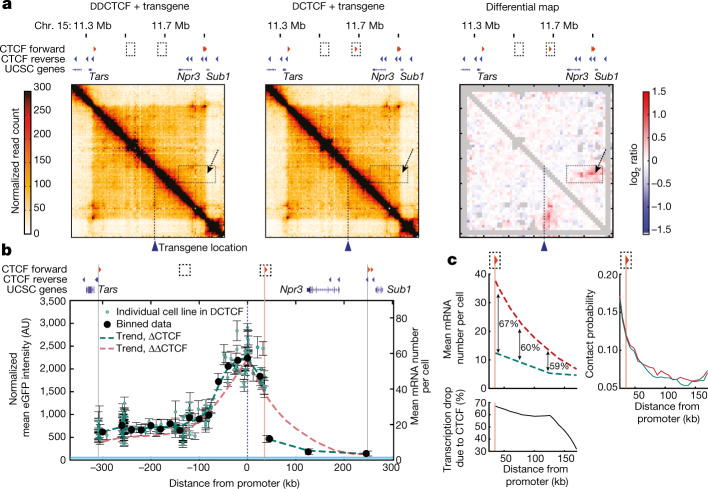
Fig. 4. Insulation by a single CTCF site exceeds contact probability changes.
a, Capture-C (6.4 kb resolution) analysis of founder mES cell lines in the absence (ΔΔCTCF) or presence (single CTCF-site deletion, ΔCTCF) of a forward CTCF motif 36 kb downstream of the transgene, and the corresponding differential map. The grey pixels show ‘noisy’ interactions that did not pass quality control filters (Methods). The dotted boxes and arrows indicate the position of the CTCF site and the structural changes it generates. b, The normalized mean ± s.d. eGFP levels in 172 individual eGFP+ cell lines following SCR mobilization in ΔCTCF mES cells (green dots); n = 3 measurements performed on different days. The black dots show the mean ± s.d. values within equally spaced 20 kb bins. The green dashed line shows the spline interpolation of average eGFP values. The vertical pink line shows the position of the CTCF site at +36 kb. The red dashed line shows the trend of eGFP levels in the ΔΔCTCF background (compare with Fig. 1h). The blue line shows the promoter-only eGFP level as in Fig. 1h. c, Magnification of spline interpolants of GFP+ cell lines in the absence (ΔΔCTCF, red dashed line) or presence (ΔCTCF, green dashed line) of the CTCF binding site at +36 kb (vertical pink line) (left). The numbers represent the percentage fold changes between trendlines. Bottom, the percentage fold changes as a function of distance from the promoter. Right, contact probabilities from the location of the ectopic Sox2 transgene in ΔΔCTCF (red line) and ΔCTCF (green line) mES cells.

