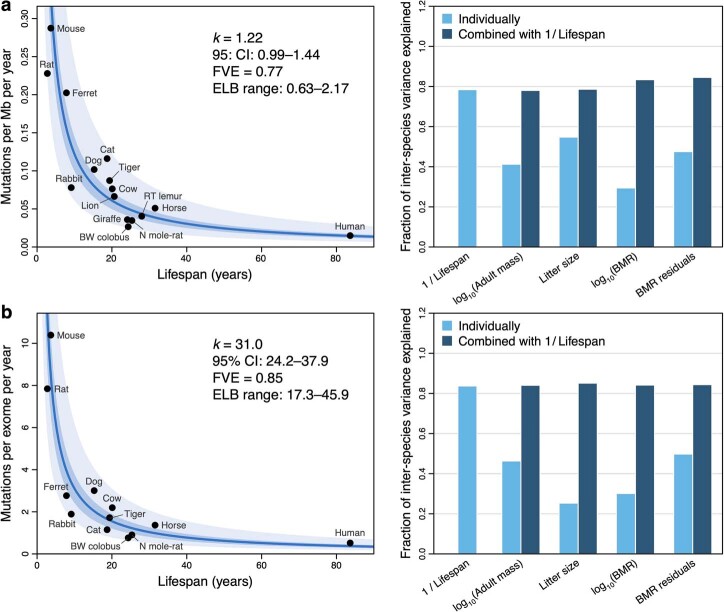
Extended Data Fig. 11. Associations between life-history variables and alternative measures of somatic mutation rate.
a, b, Same analyses as Fig. 3c, f, but using somatic mutation rates per megabase (a), or per protein-coding exome (b), rather than per genome (Methods). Leftmost panels show zero-intercept LME regressions of somatic mutation rates on inverse lifespan (1/lifespan), presented on the scale of untransformed lifespan (x axis). The y axes present mean mutation rates per species, although mutation rates per crypt were used in the regressions. Darker shaded areas indicate 95% confidence intervals (CI) of the regression lines; lighter shaded areas mark a two-fold deviation from the regression lines. Point estimate and 95% CI of the regression slope (k), fraction of inter-species variance explained (FVE), and range of ELB are provided. Rightmost panels show comparisons of FVE values achieved by free-intercept LME models using inverse lifespan and other life-history variables (alone or in combination with inverse lifespan) as explanatory variables. BW, black-and-white; N, naked; RT, ring-tailed.

