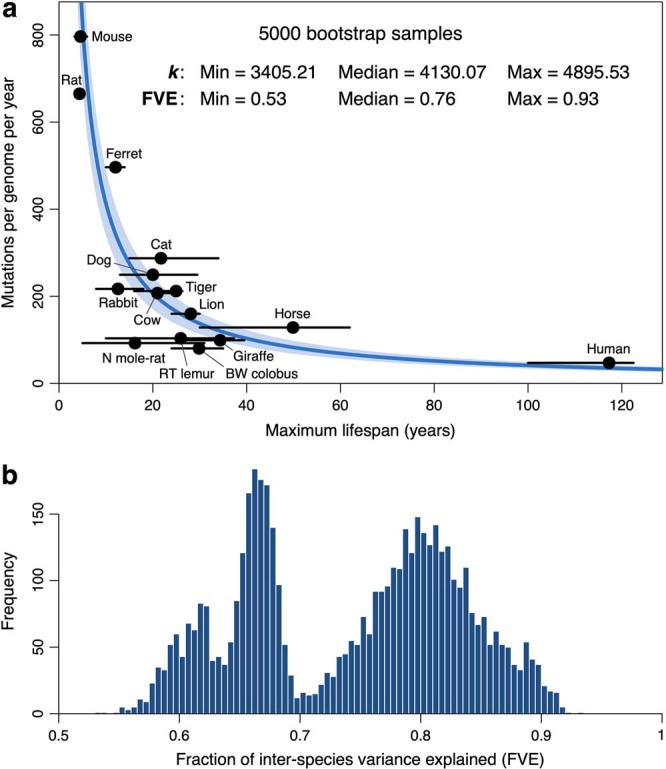
Extended Data Fig. 12. Bootstrapped regression of somatic mutation rates on published lifespan estimates.

a, Bootstrapped regression of somatic substitution rates on the inverse of lifespan (1/lifespan), using a zero-intercept LME model (Methods). For each of 5,000 bootstrap samples (replicates), lifespan values per species were randomly chosen from a set of published maximum longevity estimates (Supplementary Table 6). The blue line indicates the median regression slope (k) across bootstrap samples, and the shaded area depicts the range of estimates of k across bootstrap samples. Black dots and error bars indicate the mean and range, respectively, of published longevity estimates for each species. The median and range of both k and the fraction of inter-species variance explained (FVE) are provided. b, Histogram of FVE values across the 5,000 bootstrap samples.
