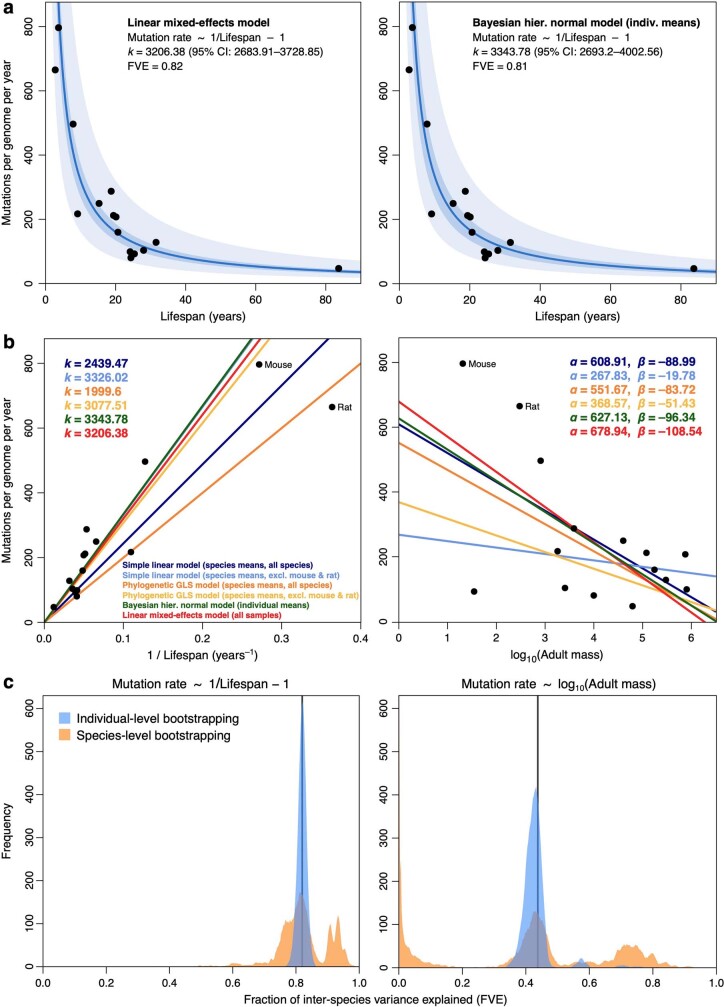
Extended Data Fig. 13. Comparison of regression models for somatic mutation rates.
a, Zero-intercept regression of somatic substitution rates on inverse lifespan (1/lifespan), using a LME model applied to mutation rates per crypt (left) and a Bayesian hierarchical normal regression model applied to mean mutation rates per individual (Methods). For simplicity, black dots present mean mutation rates per species. Darker shaded areas indicate 95% confidence/credible intervals (CI) of the regression lines; lighter shaded areas mark a two-fold deviation from the regression lines. Point estimates and 95% CI of the regression slopes (k) and fraction of inter-species variance explained (FVE) are provided. b, Comparison of regression lines for the regression of somatic substitution rates on 1/lifespan (left; zero intercept) and log-transformed adult body mass (right; free intercept), using simple linear models (dark and light blue), phylogenetic generalized least-squares models (orange and yellow), Bayesian hierarchical normal models (green) and LME models (red) (Methods). Point estimates of the regression coefficients for each model are provided. c, Distributions of regression FVE under individual- and species-level bootstrapping. For the LME models regressing somatic mutation rates on inverse lifespan (zero intercept; left) and log-transformed mass (free intercept), the curves present distributions of FVE from 10,000 bootstrap replicates, obtained through random resampling of either individuals (blue) or species (orange) (Methods). Vertical lines indicate the FVE values obtained using the entire dataset.

