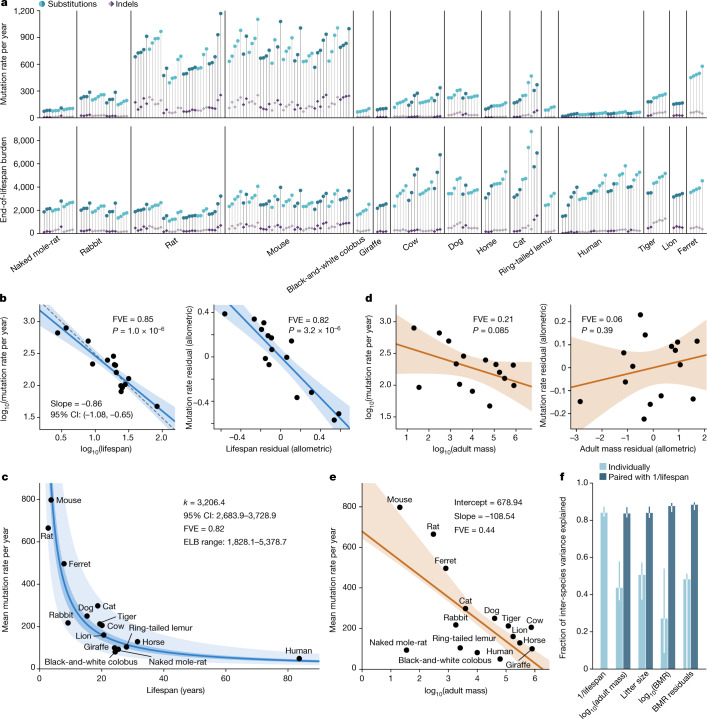
Fig. 3. Associations between somatic mutation rates and life-history traits.
a, Somatic mutation rate per year and expected end-of-lifespan mutation burden (ELB) per crypt. Samples are arranged horizontally as in Fig. 1b; harbour porpoise samples were excluded owing to the age of the sampled individual being unknown. b, Left, allometric regression of somatic mutation rate on lifespan. Right, regression of body-mass-adjusted residuals for somatic mutation rate and lifespan (partial correlation; Methods). Regression was performed using mean mutation rates per species. Shaded areas represent 95% confidence intervals (CI) of regression lines. FVE and P values (by F-test) are indicated (note that, for simple linear regression, FVE = R2). The dashed line denotes a reference slope of –1. c, Zero-intercept LME regression of somatic mutation rate on inverse lifespan (1/lifespan), presented on the scale of untransformed lifespan (x axis). For simplicity, the y axis shows mean mutation rates per species, although rates per crypt were used in the regression. The darker shaded area indicates 95% CI of the regression line, and the lighter shaded area marks a twofold deviation from the line. Point estimate and 95% CI of the regression slope (k), FVE and range of end-of-lifespan burden are indicated. d, Allometric regression and linear regression of lifespan-adjusted residuals, for somatic mutation rate and body mass (elements as described in b). e, Free-intercept LME regression of somatic mutation rate on log-transformed body mass. The y axis shows mean mutation rates per species, although rates per crypt were used in the regression. Shaded area indicates 95% bootstrap interval of the regression line (n = 10,000 replicates). Point estimates of the regression intercept and slope, and FVE, are indicated. f, FVE values for free-intercept LME models using 1/lifespan or other life-history variables (alone or combined with 1/lifespan) as explanatory variables. Error bars indicate 95% bootstrap intervals (n = 10,000).

