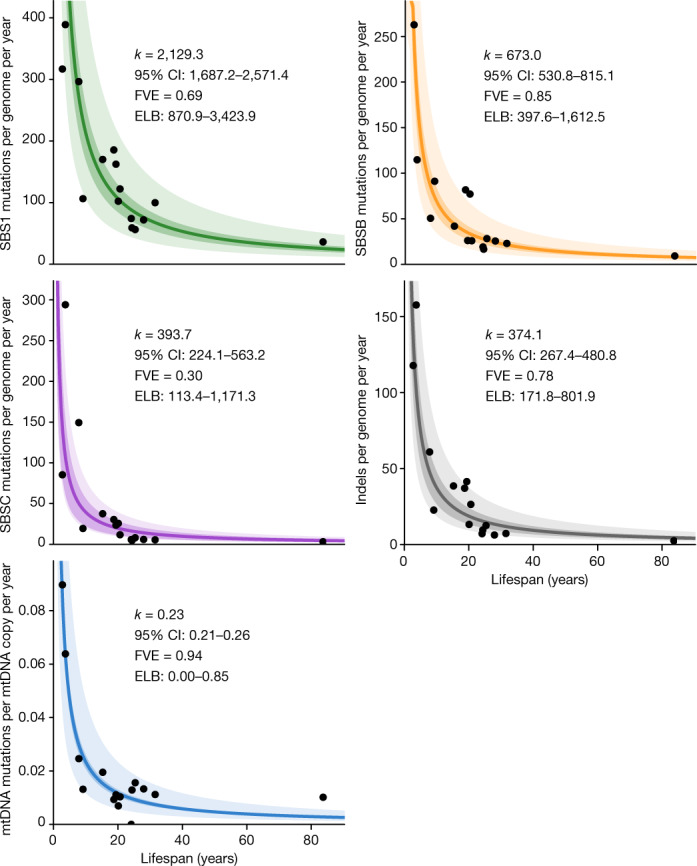
Fig. 4. Association between mutation rate subtypes and species lifespan.

Zero-intercept LME regression of somatic rates of signature-specific substitutions, indels and mtDNA mutations on inverse lifespan (1/lifespan), presented on the scale of untransformed lifespan (x axis). For simplicity, y axes present mean mutation rates per species, although mutation rates per crypt were used in the regressions. The darker shaded areas indicate 95% confidence intervals (CI) of the regression lines, and the lighter shaded areas mark a twofold deviation from the regression lines. Point estimates and 95% CI of the regression slope (k), fraction of inter-species variance explained by for each model (FVE) and ranges of end-of-lifespan burden (ELB) are indicated.
