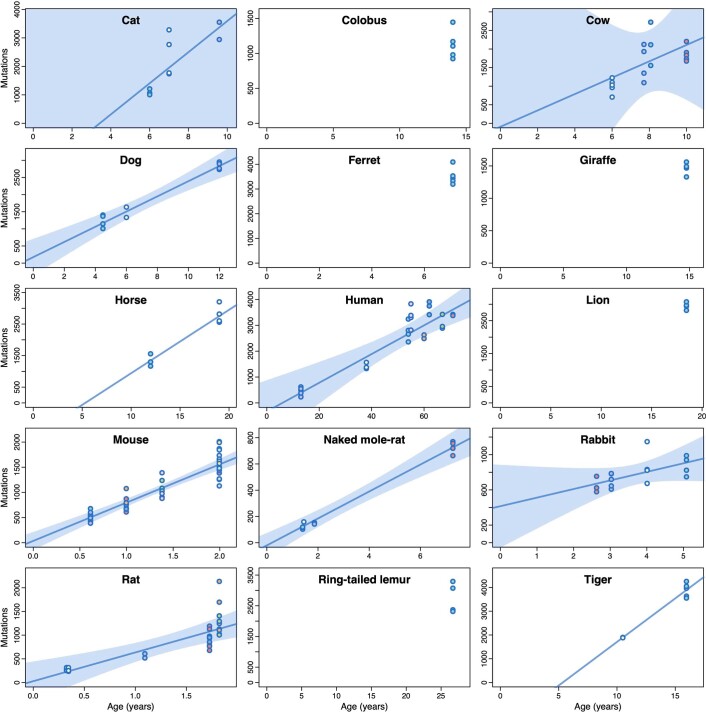
Extended Data Fig. 4. Somatic mutation accumulation across species.
Each panel presents somatic substitution burdens per genome (corrected for analysable genome size) for a given species. Each dot represents a crypt sample, with samples from the same individual sharing the same colour. For species with two or more individuals, the estimated regression line from a simple linear regression model on individual mean burdens is shown. For species with three or more individuals, the shaded region indicates 95% confidence intervals of the regression line. Harbour porpoise samples were excluded owing to unknown age of the sampled individual.

