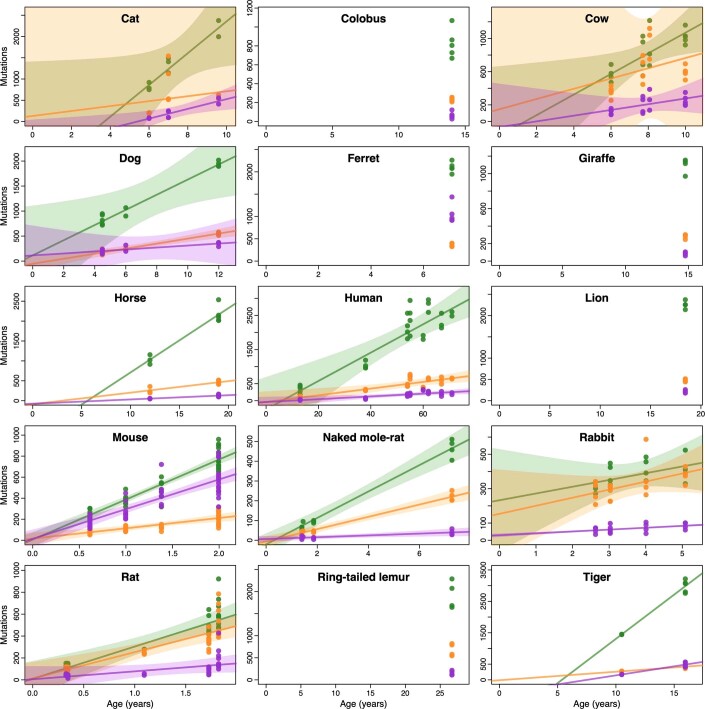
Extended Data Fig. 5. Signature-specific mutation accumulation across species.
Each panel presents somatic substitution burdens per genome for mutational signatures SBS1 (green), SBSB (yellow) and SBSC (purple) in a given species. For species with two or more individuals, the estimated regression lines from simple linear regression models on individual mean burdens per signature are shown. For species with three or more individuals, shaded regions indicate 95% confidence intervals of the regression lines. Harbour porpoise samples were excluded owing to unknown age of the sampled individual.

