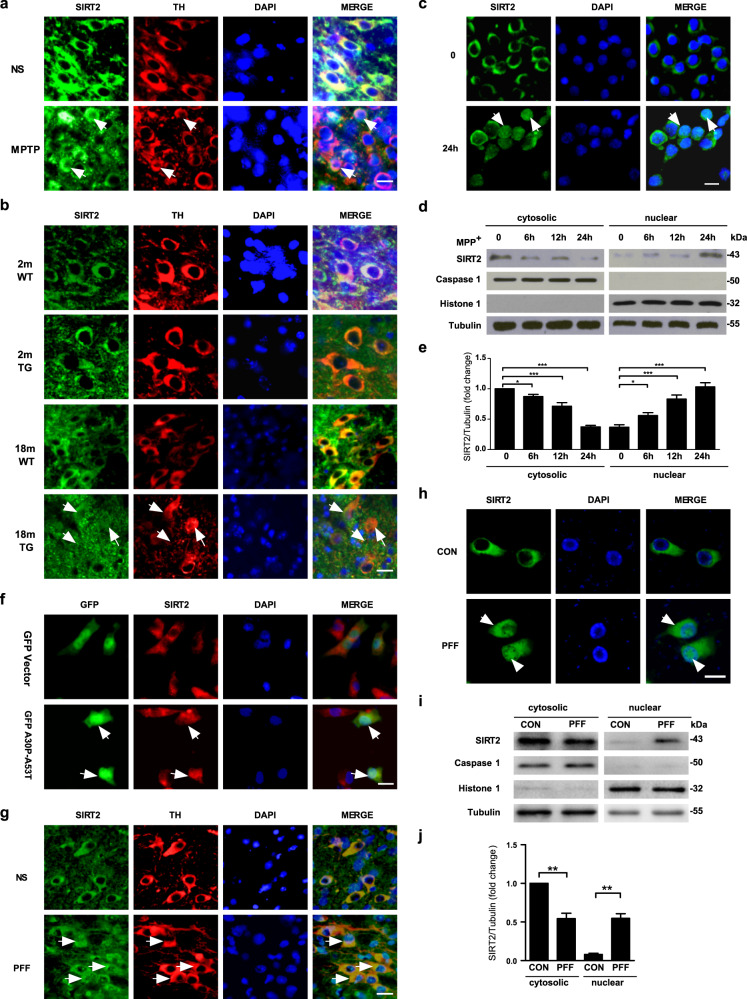
Fig. 3. SIRT2 translocates from the cytoplasm to the nucleus in PD.
a, b Subcellular localization of SIRT2 was monitored using dual immunolabeling for TH (red) and SIRT2 (green) in the SNpc in mice treated with normal saline (NS) or MPTP (a) as well as in WT and α-synuclein-A30P*A53T transgenic mice (TG) (b). c Immunofluorescence assays for SIRT2 (green) were conducted in primary culture neurons treated with 50 μM MPP+ for 24 h. d The localization of SIRT2 was detected using nuclear/cytosolic immunoblotting in primary culture neurons treated with 50 μM MPP+ for 0, 6, 12, and 24 h. e Quantification of SIRT2 protein levels in the cytoplasm and nucleus (separate from d). f SH-SY5Y cells were transiently transfected with GFP vector (green) or GFP-α-synuclein-A30P*A53T (green) plasmids for 24 h and subsequently immunostained for SIRT2 (red) and observed using confocal microscopy. g Subcellular localization of SIRT2 examined using dual immunolabeling for TH (red) and SIRT2 (green) in the mouse SNpc 35 days after the striatal stereotactic injection of 2 μl (per side) normal saline (NS), or α-synuclein PFF (Abcam, ab246002, 1 μg/μl). h Localization of SIRT2 detected using nuclear/cytoplasmic immunofluorescence staining in primary culture neurons treated with 4 μg/ml PFF for 7 days. i Localization of SIRT2 detected using nuclear/cytosolic immunoblotting in primary culture neurons treated with 4 μg/ml PFF for 7 days. j Quantification of SIRT2 protein levels in the cytoplasm and nucleus (separate from [i]). The scale bar represents 20 μm. All data are presented as the means ± SD. Statistical analyses were conducted using one-way ANOVA followed by Tukey’s post hoc test in (e). Statistical analyses were conducted using two-way ANOVA followed by Tukey’s post hoc test in (j). *P < 0.05, **P < 0.01, ***P < 0.001.

