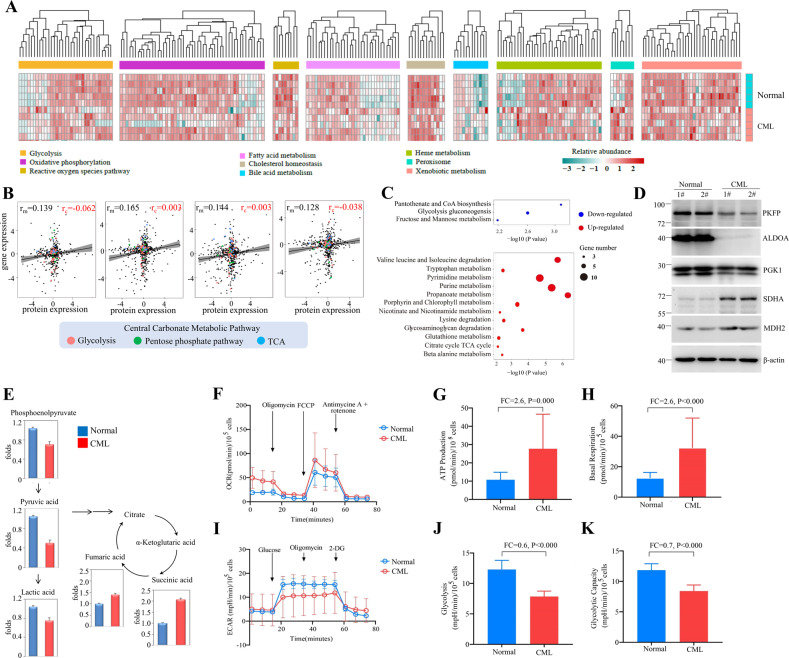
Fig. 2. CD34+ CML cells showed increased OXPHOS and decreased glycolysis.
A Hierarchical clustering analysis for nine HALLMARK metabolic pathways between CD34+ CML and normal samples. Clustering was done using Euclidean distance and complete linkage method with the differentially expressed genes (FC > 2 and P < 0.01) that annotated in the metabolic pathways. Quantile normalization was applied prior to the analysis. B Correlation between metabolic proteomic/transcriptomic in primitive CML CD34+ cells using Pearson method. Filled black circles indicate all metabolic proteins/genes in KEGG (n = 1,480); filled red, green, and blue circles indicate proteins/genes in central carbonate metabolic pathway (n = 101). rm all metabolic proteins/genes correlation, rc central metabolic proteins/genes correlation. C Bubble plot representation of selected KEGG pathways that are enriched in the metabolic categories for CD34+ CML samples. The size of each bubble corresponds to the number of genes within the given gene set. The pathways enriched in upregulated genes are colored in red, and pathways enriched in downregulated genes are colored in blue. D Western blot analysis of proteins in TCA and glycolysis. E Comparative metabolomics analyses of primary CD34+ purified from CML or normal donors performed via LC-MS. Data are shown as the mean from n = 3 experiments. F Oxygen consumption rate (OCR) levels were examined in normal or CML CD34+ using a Seahorse XF96 analyzer (n = 3). G, H ATP levels and basal respiration were examined. I Extracellular acidification rates (ECAR) of CD34+ purified from CML or normal donors were measured by Seahorse Glycolysis Stress Kit. J, K Level of glycolysis and glycolytic capacity were examined.

