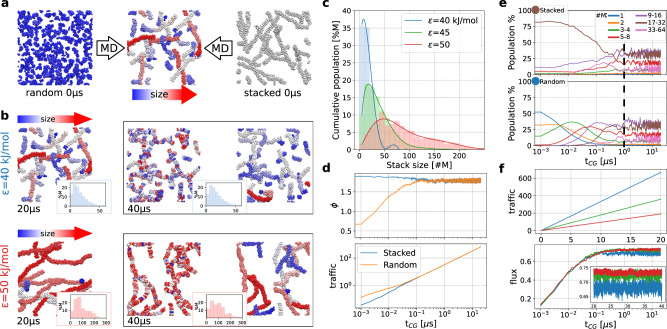
Fig. 2. Dynamic equilibrium in a minimalistic self-assembling model.
a CG-MD simulations of a model system composed of 500 M monomers, starting from randomly dispersed monomers (R case, left) or monomers pre-stacked into 20 equal fibres (S case, right). During CG-MD both systems relax to the same dynamical equilibrium state (centre: example snapshot). The assemblies are coloured based on their size (see colour bar). b CG-MD snapshots for the ϵ = 40 kJ mol−1 (top) and ϵ = 50 kJ mol−1 (bottom) systems. Left: snapshots at tCG = 20 μs (assemblies coloured according to their size). Centre: snapshots at tCG = 40 μs, where the monomer colouring used at tCG = 20 μs (left) is preserved - the colour reshuffling indicates molecular exchange after equilibrium is reached. Right: same snapshots as centre but assemblies recolored according to their current size (at tCG = 40 μs). The relative assembly-size distributions are reported in the insets. c Average distribution of aggregate sizes for different ϵ values at the equilibrium. d Average coordination number ϕ between the M centres (top) and cumulative molecular traffic55 (bottom) along CG-MD in the S and R cases. e Evolution of the assembly-size populations for the S (top) and R (bottom) cases. The brown and blue circles at tCG = 0 indicate the initial population in the two cases. After tCG = 1 μs (vertical dashed black line) the two systems reach a comparable microscopic equilibrium state, and the populations plateau. f Molecular traffic and flux55 vs. time at different ϵ values.

