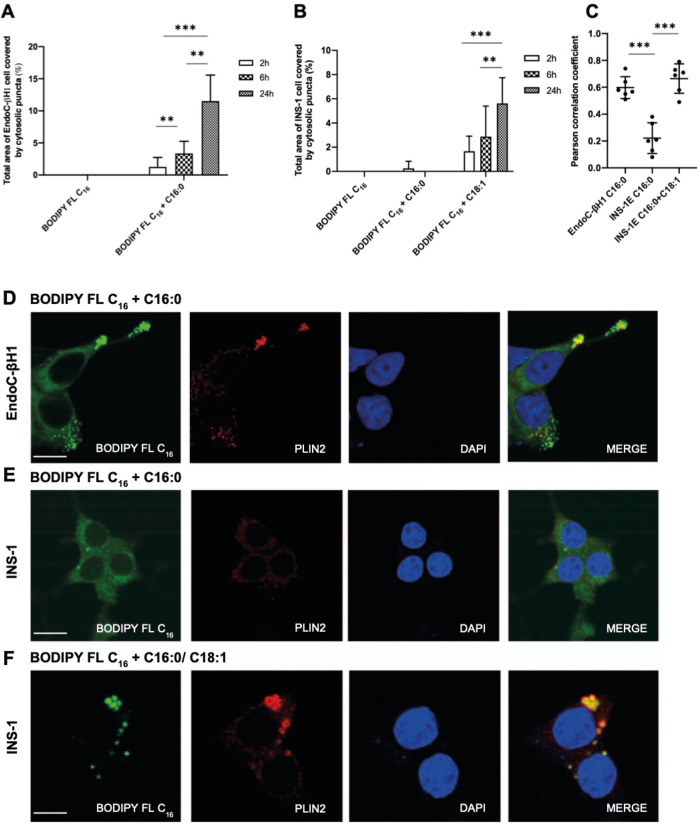
Fig. 2. Cytoplasmic lipid droplets form rapidly in EndoC-βH1 exposed to palmitate (C16:0), but this does not occur in INS-1E cells unless oleate (C18:1) is also present.
Quantification of the total area of EndoC-βH1 (A) and INS-1E (B) cells covered by fluorescent puncta after treatment with C16:0 (500 μM) and BODIPY FL C16 (400 nM) alone or in INS-1E cells, in combination with 250 μM C18:1 for 2 h, 6 h or 24 h. Images were analysed using ImageJ/FIJI software where the area of cell covered by fluorescent puncta was divided by the total cell area, and the results expressed as a percentage of the total. C Pearson correlation coefficient demonstrating the co-localisation BODIPY FL C16 with PLIN2. Dots represent individual data points. Representative immunofluorescence staining of BODIPY FL C16 (green), PLIN2 (red), and DAPI (blue) in EndoC-βH1 (D) and INS-1E (E, F) cells following a 24 h treatment with C16:0 [500 μM] and BODIPY FL C16 [400 nM] alone or in INS-1E cells, in combination with 250 μM C18:1 for 24 h. Merged images included to show co-localisation. Scale bars 10 μm. Data represents mean + SD (N = 3). **p < 0.01, ***p < 0.001 as indicated.

