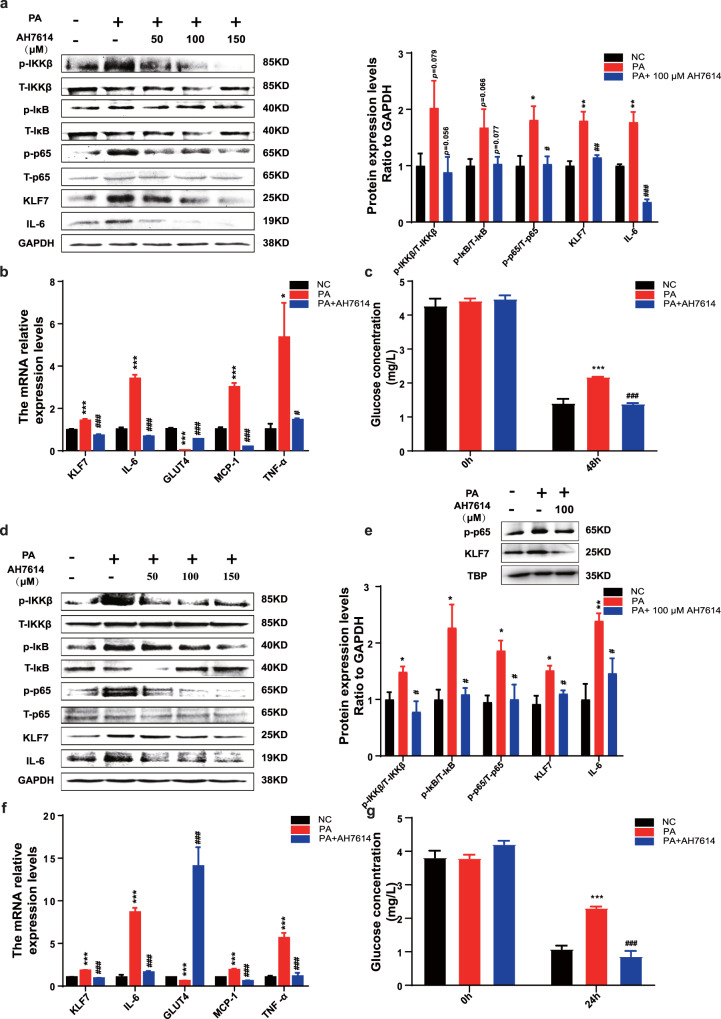
Fig. 2. PA regulates KLF7 through GPRs/p-p65 signaling pathway.
Add AH7614 (50, 100, 150 μM) to culture medium while stimulated by 200 μM PA, the protein expression levels of p-IKKβ/T-IKKβ, p-IκB/T-IκB, p-p65/T-p65, KLF7 and IL-6 in 3T3-L1 adipocytes (a) and HepG2 cells (d). The mRNA expression levels of KLF7, IL-6, GLUT4, MCP-1 and TNF-α in 3T3-L1 adipocytes (b) and HepG2 cells (f). The expression levels of KLF7, p-p65 in HepG2 nuclear extracts (e). The glucose consumption ability in 3T3-L1 adipocytes (c) and HepG2 cells (g). One-way ANOVA-LSD, *NC compared with PA group, #PA compared with AH7614 group. *p < 0.05, **p < 0.01, ***p < 0.001, #p < 0.05, ##p < 0.01, ###p < 0.001, the difference was statistically significant, data presented as means ± SEM.

