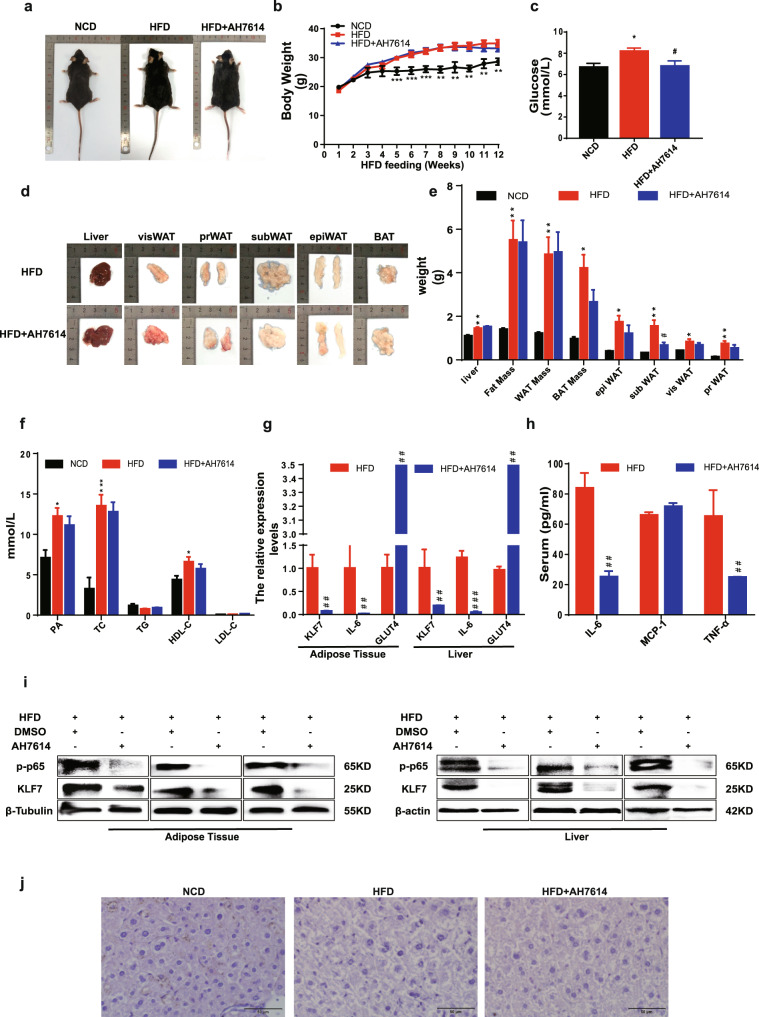
Fig. 5. The pharmacological effects of inhibit GPR120.
Male C57B/L6 mice were fed with NCD or HFD for 7 weeks, then mice in HFD group were divided into two groups, HFD group and mice intraperitoneally injected with AH7614 (2.5 mg/kg/day) for 5 weeks. The body weight of mice in NCD (n = 5), HFD (n = 8), and AH7614 group (n = 8) (a, b). Weight of liver, epiWAT, subWAT, visWAT, prWAT in NCD, HFD, and AH7614 group (d, e). Blood glucose of mice in NCD, HFD, and AH7614 group (c). Plasma levels of palmitic acid, TG, TC, LDL, HDL of mice in NCD, HFD, and AH7614 group (f) (n = 5–8). Protein expression of p-p65 and KLF7 in epiWAT and liver (i). mRNA levels of KLF7, IL-6, GLUT4 in epiWAT and liver (g). IL-6, MCP-1, TNF-α levels in mice plasma were detected using ELISA (h) HE staining of liver from mice in NCD, HFD, and AH7614 group (j). One-way ANOVA-LSD, t-test, *NCD compared with HFD group, #HFD compared with HFD + AH7614 group. *p < 0.05, **p < 0.01, ***p < 0.001, #p < 0.05, ##p < 0.01, ###p < 0.001, the difference was statistically significant, data presented as means ± SEM.

