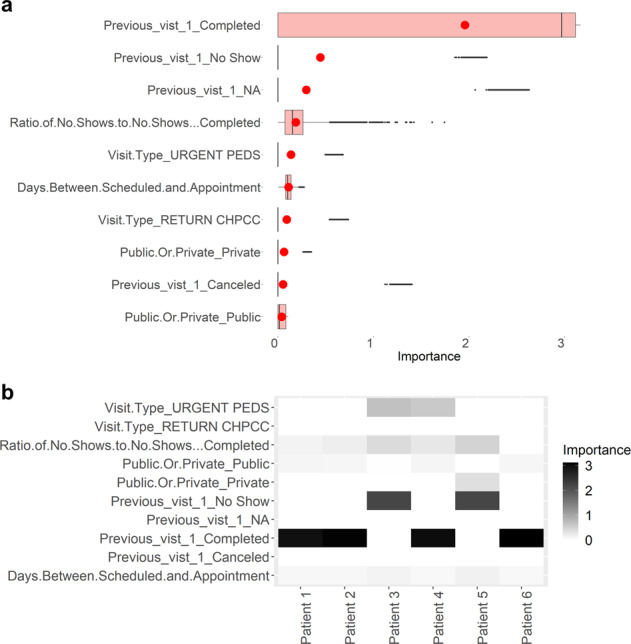
Fig. 2. Feature importance in predicting no-shows.

a Importance of each feature in predicting no-shows, where the top 10 features are shown. The red circle is the mean value of each group. In all boxplots in this study, centreline represents median, bounds of box represent first and third quantiles, and whiskers represent minimum and maximum values excluding outliers. b Examples of the importance of each feature in predicting no-shows in different visits of patients. Examples of six visits are shown.
