
Figure 1.
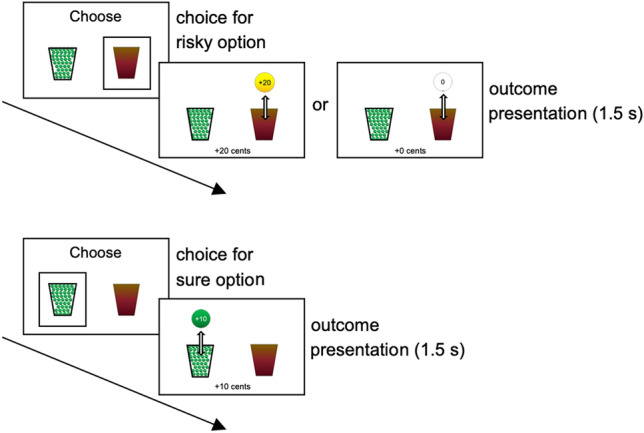
Trial outline in case of a risky (upper plot) and sure (lower plot) choice. This figure was created using Microsoft PowerPoint 16.16.27, https://www.microsoft.com/en-us/microsoft-365/powerpoint.
Official websites use .gov
A
.gov website belongs to an official
government organization in the United States.
Secure .gov websites use HTTPS
A lock (
) or https:// means you've safely
connected to the .gov website. Share sensitive
information only on official, secure websites.
Trial outline in case of a risky (upper plot) and sure (lower plot) choice. This figure was created using Microsoft PowerPoint 16.16.27, https://www.microsoft.com/en-us/microsoft-365/powerpoint.