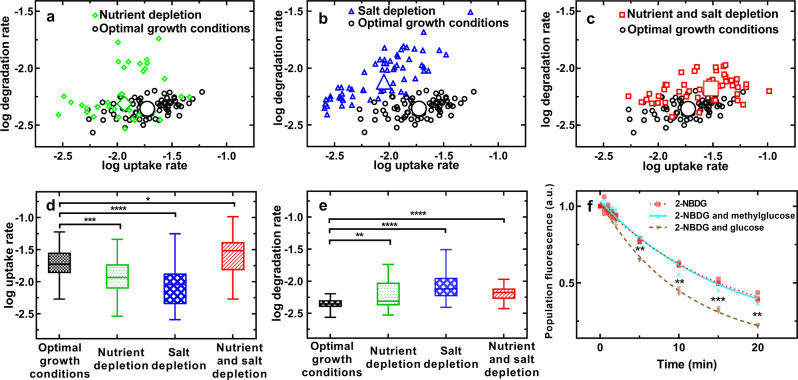
Fig. 4. Combined nutritional and salinity depletion boosts both glucose uptake and degradation.
a–c Single-cell correlation between the natural logarithm of 2-NBDG uptake rate and the natural logarithm of 2-NBDG degradation rate as predicted by Equation 1 for optimal growth conditions (circles), nutrient depletion (diamonds), salt depletion (triangles) or combined nutrient and salt depletion (squares), with Pearson correlation coefficients of 0.42 (***), 0.27 (ns), 0.80 (****) and 0.36 (*), respectively. N > 30 for each experimental condition collated from biological triplicates, the large symbols are the medians of each set of single-cell values. Coefficient of variations of these single-cell values and statistical tests of quantitative comparisons of values between different environments are reported in Supplementary Tables 5 and 6, respectively. Corresponding distributions of (d) natural logarithm of 2-NBDG uptake rate values and (e) natural logarithm of 2-NBDG degradation rate values. The bottom and top of the box are the first and third quartiles, the band inside the box is the median, the bottom and top whiskers represent the 10th and 90th percentiles, respectively. f Temporal dependence of the fluorescence of 2-NBDG when E. coli populations were incubated in 30 µM 2-NBDG alone (red squares), in the presence of 30 mM 3-O-methylglucose (cyan upward triangles), or in the presence of 30 mM glucose (brown downward triangles). N = 3 biological replicates for each condition. The lines are one phase exponential decay fittings to the data yielding time constant Tau of (16.3 ± 1.1) min, (16.3 ± 1.2) min and (10.9 ± 0.5) min, respectively. *p value < 0.05; **p value < 0.01 ***p value < 0.001; ****p value < 0.0001.

