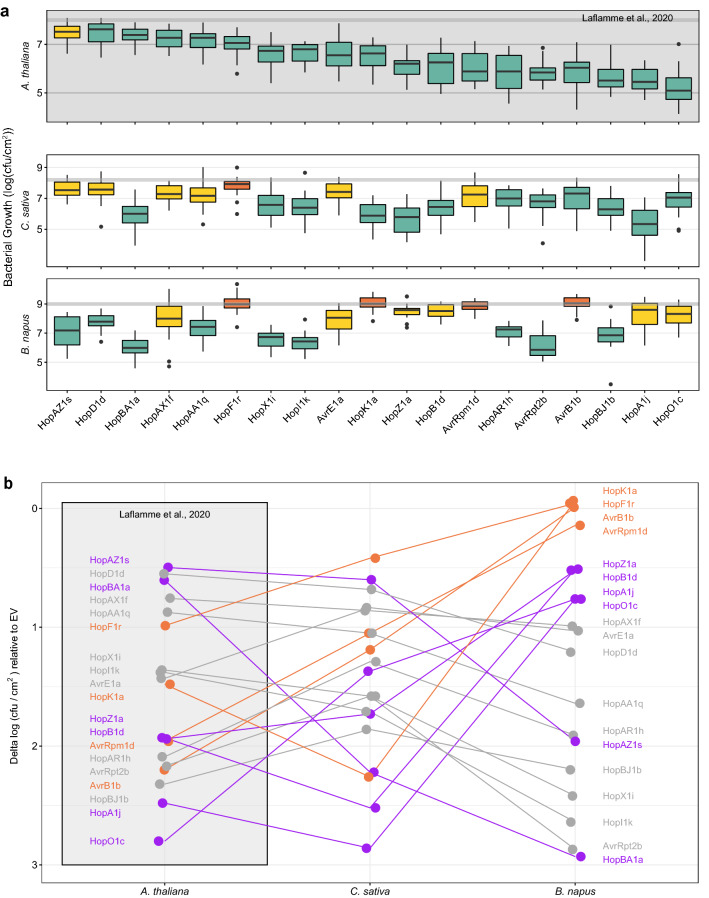
Figure 2.
Conservation of the A. thaliana Col-0 ETI responses in C. sativa var. DH55 and B. napus var. Topas. (a) Growth assays of PtoDC3000 expressing 19 ETI eliciting effectors identified in5 normalized to the empty vector (EV) across assays for each species. A. thaliana Col-0 growth assay data is from Laflamme et al., 2020. The horizontal grey line across each plot represents the normalized mean of EV controls between assays. Green boxes represent the effectors that consistently caused a significant reduction in bacterial growth compared to the EV (ANOVA with post-hoc Tukey–Kramer HSD test, P < 0.05). Yellow boxes represent the effectors that led to inconsistent reductions in bacterial growth (not significantly different from EV in at least one experimental replicate). Orange boxes represent the effectors that were not significantly different from EV in any replicate. Box and whisker plots show pooled data from three experiments (n = 7 or 8 plants / experiment). Boxes show the first quartile, median, and third quartile. Whiskers extend to the smallest, and largest values no further than 1.5 × interquartile range from the first and third quartiles, respectively. Outlying points are plotted individually as solid circles. Raw growth assay data is presented in Supplemental Figure 2. (b) ETI intensity rank order profiles for A. thaliana Col-0, B. napus var. Topas, and C. sativa var. DH55. The delta log cfu/cm2 values of the normalized means of each effector relative to EV are plotted ranging from 0.0 logs (no reduction in bacterial growth relative to EV) to 3.0 logs (largest reduction in bacterial growth corresponding with the strongest ETI responses). Lines connect the means of each effector across the three plant species. Labels represent effector names. Orange represents effectors that do not trigger ETI in B. napus or C. sativa. Purple represents effectors of interest with very different responses between plants. Grey represents effectors that show similar responses between plants.

