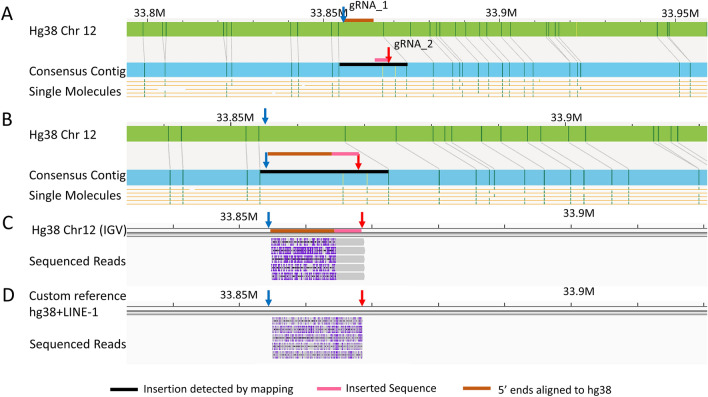
Figure 3.
An insertion detected with optical mapping resolved with our cas9-assisted targeted nanopore sequencing approach. (A) Shows a black bar at the location where the insertion was detected on chromosome 12 contig by optical mapping. (B) Shows a zoomed in view the insertion on the contig and the gRNA pair, blue and red arrows, designed to target this region. The brown and pink bars represent the expected fragment generated by the gRNA pair. The brown bar represents part of fragment aligning to hg38 and the pink bar represents part of fragment containing partial insertion sequence. (C) Shows the sequenced reads aligning between the designed gRNA cut sites. Coverage was 5X. All fragments had two segments as expected. The part of reads representing aligning portions are marked by a brown bar on the IGV reference. The part of reads not aligning are marked by the pink bar. (D) Shows the same reads aligning to a custom reference where the reference consisted of hg38 sequence with a LINE-1 reference inserted at the detected breakpoint.

