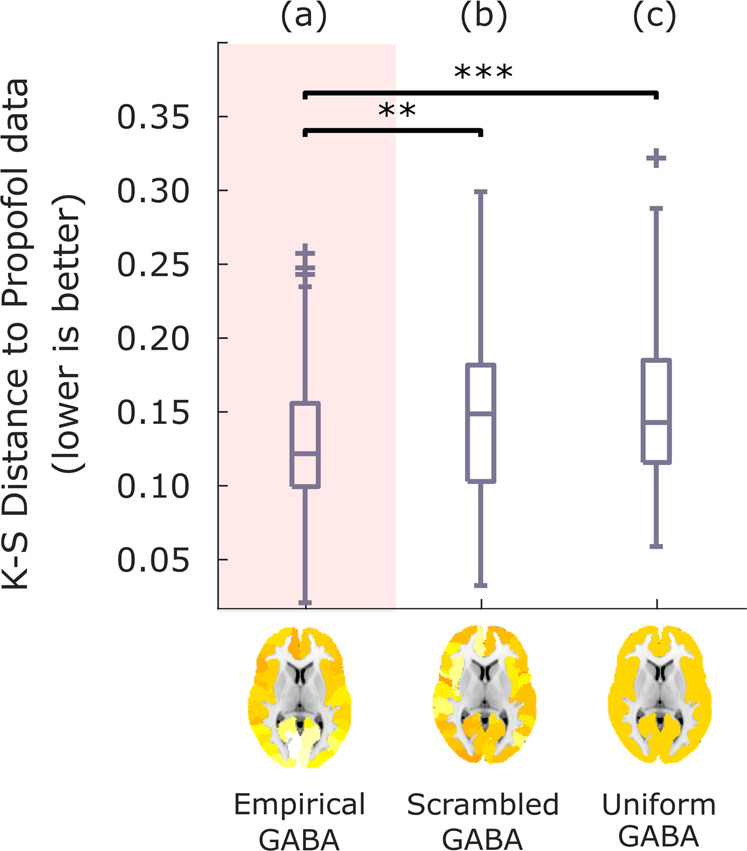
Fig. 3. Modulation of inhibitory gain by reshuffled or uniform GABA-A receptor density.

After identifying the value of sI that leads to the best fit with the empirical propofol data when modulating the inhibitory gain of each node in the balanced DMF model according to the empirical distribution of GABA-A receptors (a), the simulation is repeated after randomly reshuffling the regional receptor densities across the cortex (b), or setting them all to a uniform value (mean of the empirical distribution) (c). Box-plots show the model fit to the propofol data for n = 100 simulations, quantified as KS-distance (lower is better) between simulated and empirical FCD, for each variant of the model. Middle line: median; box limits, upper and lower quartiles; whiskers, 1.5x inter-quartile range; “+” symbol indicates outliers; **p < 0.01; ***p < 0.001 from t-test. Source data are provided in Supplementary Data 1. We replicated this result using an alternative version of the KS-distance, which in addition to the distribution of FCD values also takes into account the temporal lag between them (Supplementary Fig. 2).
