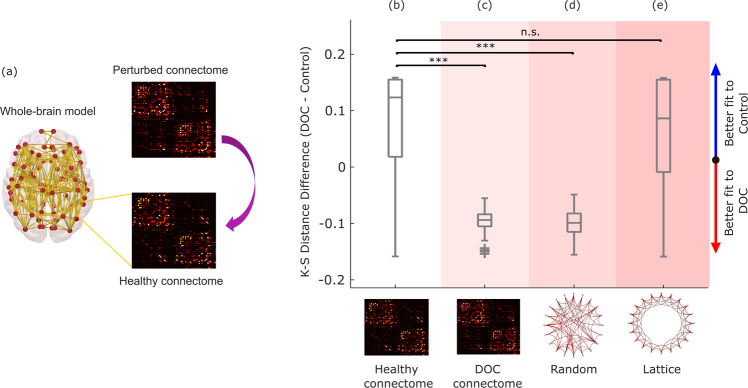
Fig. 4. Connectome replacement analysis with DOC connectome.
a The original healthy connectome of the model is replaced with the group-average connectome obtained from diffusion MRI of n = 21 DOC patients, and the resulting model is used to generate n = 100 simulations. b–e Box-plots show the difference in model fit (KS-distance) between the two conditions (fit to DOC patients’ data minus fit to healthy controls’ data, over n = 100 simulations), for the initial model calibrated based on the healthy connectome (b), and after replacing the model’s initial connectome with either the DOC patients’ empirical consensus connectome (c), or after rewiring the initial connectome into a random network (d), or into a regular (lattice) network (e). Middle line: median; box limits, upper and lower quartiles; whiskers, 1.5x inter-quartile range; “+” symbol indicates outliers; ***p < 0.001; n.s. Not significant (p > 0.05) from t-test. Source data are provided in Supplementary Data 2. We replicated this result using an alternative version of the KS-distance, which in addition to the distribution of FCD values also takes into account the temporal lag between them (Supplementary Fig. 3).

