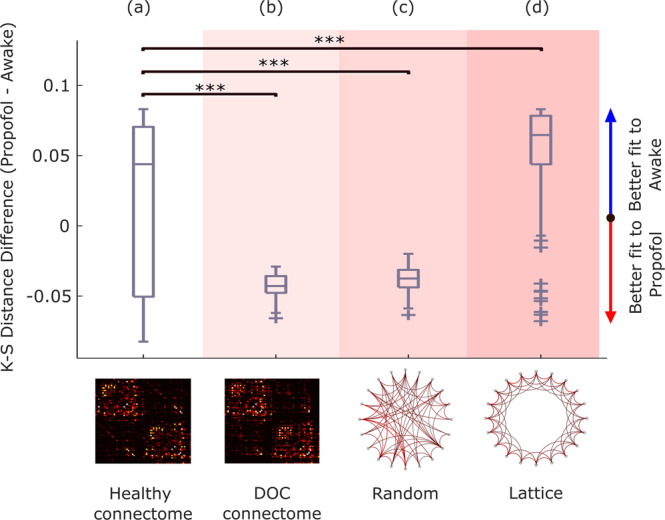
Fig. 6. Connectome replacement analysis with DOC connectome generalises to propofol anaesthesia.

Box-plots show the difference in model fit (KS-distance) between the two conditions (fit to propofol data minus fit to awake data, over n = 100 simulations), for the initial model calibrated based on the healthy connectome (a), and after replacing the model’s initial connectome with either the DOC patients’ empirical consensus connectome (b), or after rewiring the initial connectome into a random network (c), or into a regular (lattice) network (d). Middle line: median; box limits, upper and lower quartiles; whiskers, 1.5x inter-quartile range; “+” symbol indicates outliers; ***p < 0.001 from t-test. Source data are provided in Supplementary Data 4.
