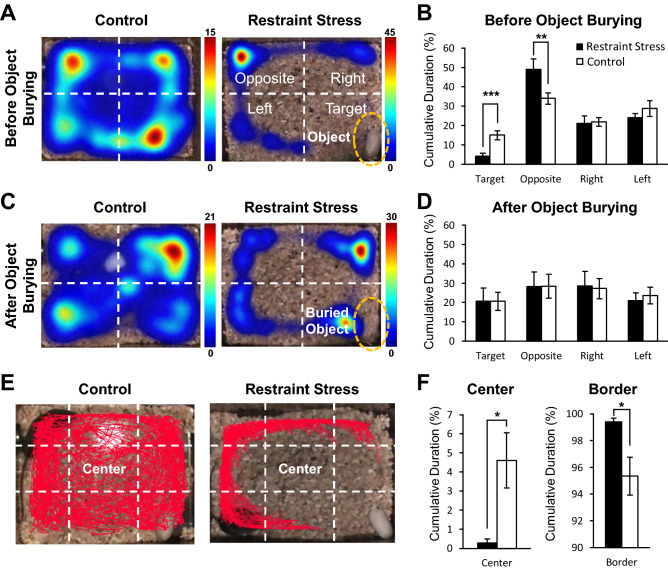
Figure 2.
Anxiety-like behavior exhibited in mice exposed to restraint stress. (A, C) An experimental cage was divided into four quadrants—opposite (furthest zone from where a restrainer-resembling object was placed), right, left, and target (the zone where a restrainer-resembling object was placed) zones—to analyze differences in movement trajectory between groups. Color scale on the right of each heat map denotes the dwell duration measured in seconds: the hotter the color, the longer the dwell duration. (A) Representative heat map analysis showing cumulative dwelling time in the experimental cage of each group before a restrainer-resembling object was buried (0–5 min after experiment). (B) Comparison of cumulative duration in respective quadrants between groups before a restrainer-resembling object was buried (0–5 min after experiment). (C) Representative heat map analysis showing cumulative dwelling time in the experimental cage of each group (from same animals shown in A) after a restrainer-resembling object was buried (10–15 min after experiment). (D) Comparison of cumulative duration in respective quadrants between groups after a restrainer-resembling object was buried (10–15 min after experiment). (E) Example trajectory of a control and stressed mice. Red line indicates trajectory of a mouse during the test. White dashed lines divide each experimental cage into the center and border zone. (F) Cumulative duration in the center or border zone between groups. (B, D, F) All data are presented as mean ± SEM. Student’s t-test was used to compare means between the stress and the control group. *p < 0.05, **p < 0.01, ***p < 0.001. (A–F) All the behavioral analyses were performed with data acquired from the first experiment (day 1).

