Figure 2.
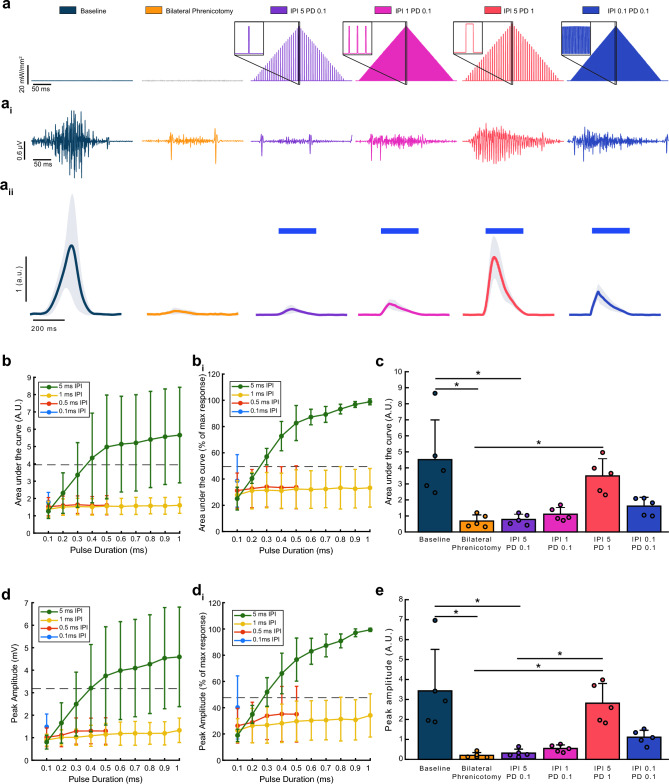
Impact of light train inter-pulse interval and pulse duration on the evoked diaphragm EMG response. (a) Graphical depiction of the four different stimulus trains. (ai) Representative EMG responses are shown beneath each paradigm. (aii) Rectified and integrated diaphragm EMG activity averaged across animals (n = 5). Depicted are cycle triggered averages of inspiratory EMG bursting during spontaneous breathing at baseline and following bilateral phrenicotomy. Also depicted are stimulus triggered averages for light-evoked EMG activation. The solid color lines represent mean data and the shaded region represents one standard deviation. The blue bars represent onset and duration of stimulation. (b) Diaphragm EMG responses, presented as area under the curve of integrated EMG bursts, (n = 4, unilateral phrenicotomy) to 250 ms trains of light pulses. Pulse durations ranged from 0.1 to 1 ms and inter-pulse intervals of 0.1, 0.5, 1, and 5 ms. (bi) Area under the curve analysis, presented as percentage of maximal evoked response. Grey dotted lines represent average area under the curve during endogenous diaphragm bursting. (c) Area under the curve for the integrated diaphragm EMG bursts (n = 5, bilateral phrenicotomy), for each of the four stimulation paradigms tested (one-way repeated measures ANOVA on ranks, p < 0.001, *Tukey’s post-hoc comparison p < 0.05, horizontal lines indicate significant post-hoc differences between the two histograms where the line starts and ends). Data are presented as the average area under the curve + 1 stdev. (d) Peak diaphragm EMG amplitude response (n = 4, unilateral phrenicotomy) to short trains of light pulses with pulse durations ranging from 0.1 to 1 ms and inter-pulse intervals of 0.1, 0.5, 1, and 5 ms. (di) Peak amplitude diaphragm EMG response, as a percentage of maximal evoked response, to short trains of light pulses with pulse durations ranging from 0.1 to 1 ms and inter-pulse intervals of 0.1, 0.5, 1, and 5 ms. Grey dotted lines represent average peak amplitude during endogenous diaphragm bursting. (e) Peak amplitude (n = 5, bilateral phrenicotomy) for stimulation paradigms of interest (one-way repeated measures ANOVA on ranks p < 0.001, *Tukey’s post-hoc comparison p < 0.05, horizontal lines indicate significant post-hoc differences between the two histograms where the line starts and ends). Data are presented as the average peak amplitude + 1 stdev.

