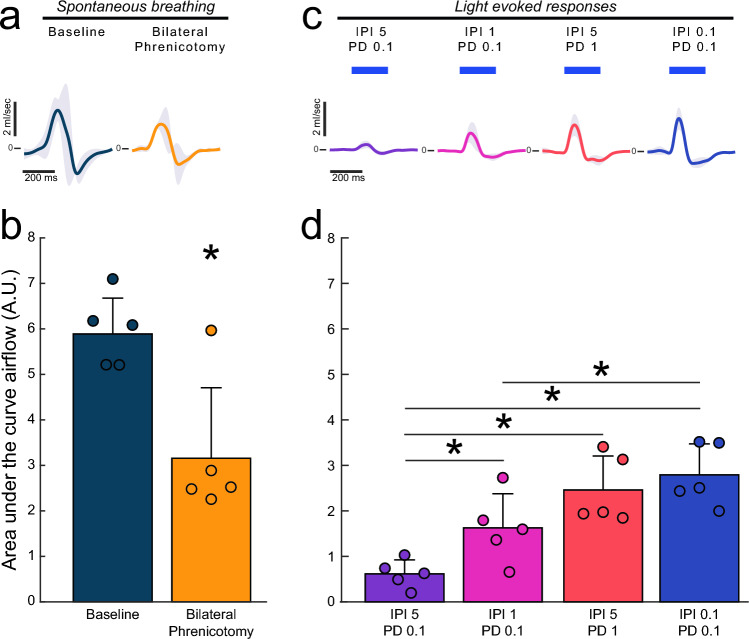
Figure 3.
Diaphragm photostimulation can produce respiratory airflow. (a) Cycle triggered averages of airflow across the respiratory cycle during spontaneous breathing at baseline and immediately after the bilateral phrenicotomy. The upward deflection represents inspiration. Solid color lines represent mean data, shaded regions represent one standard deviation. The average respiratory airflow under these conditions is shown in panel (b). Paired t-tests showed a difference in airflow between baseline and bilateral phrenicotomy (p = 0.045). (c) Stimulus triggered averages of the respiratory flow waveform across all animals (n = 5). Blue bars represent onset and duration of stimulation. Panel (d) presents the area under the curve of the evoked airflow traces for the four stimulus conditions tested. Data are presented as mean + 1 stdev with scatter showing data for individual animals. One way repeated measures ANOVA showed an effect of stimulation on airflow (p < 0.001), black lines indicated significant differences between groups (p < 0.05).

