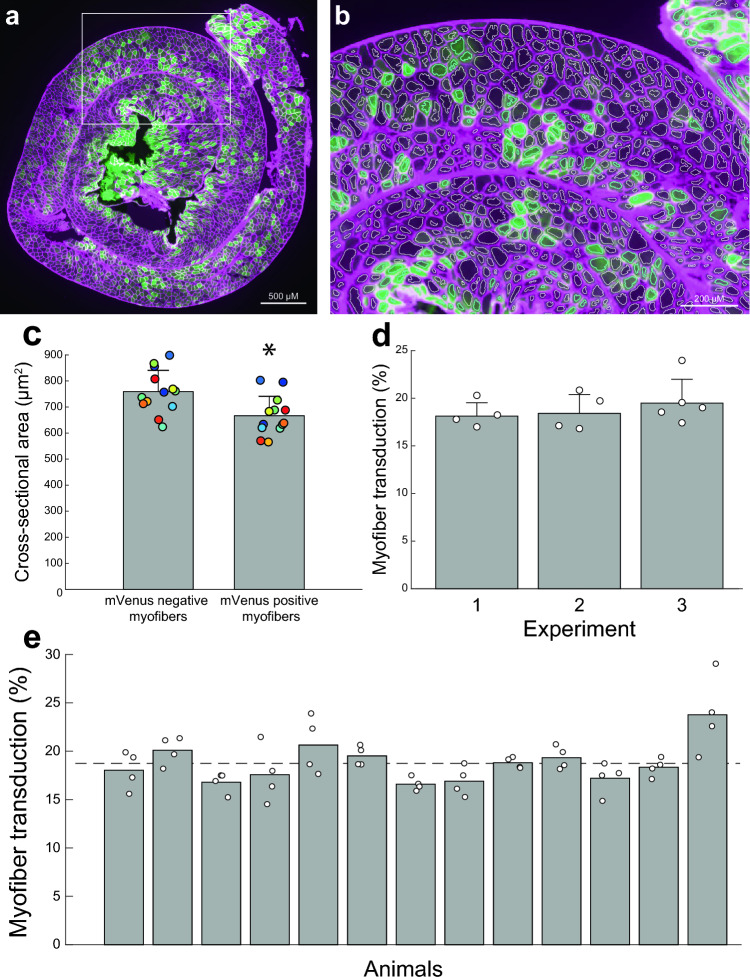
Figure 5.
Transduction of diaphragm myofibers following intrapleural microinjection of AAV9. (a) Representative diaphragm histology. The diaphragm was rolled prior to sectioning so that cross sections enabled visualization of fibers throughout the costal region. The green myofibers show the presence of the mVenus fluorescence tag. (b) Inset from panel (a), myofibers identified by the MATLAB analysis script are outlined with white borders, mVenus positive fibers can be appreciated by the green color and are outlined with blue borders. (c) Diaphragm myofiber cross-section area for mVenus positive and mVenus negative myofibers. The scatter plot shows the average cross-sectional area for mVenus positive and negative myofibers from each animal (n = 13). Color of scatter corresponds to each individual animal. Wilcoxon rank sum test suggests a significant difference between cross-sectional area of mVenus positive and negative myofibers (p = 0.008). (d) Comparison of diaphragm transduction across the three different experiments. One way ANOVA suggested no differences in percent transduction between experiments (p = 0.59). (e) Percent transduction for each individual animals (n = 13). The scatter plot shows the data for each individual tissue section (n = 4 per mouse). The histogram shows the average for each mouse and the dotted line shows average percent transduction across all animals.

