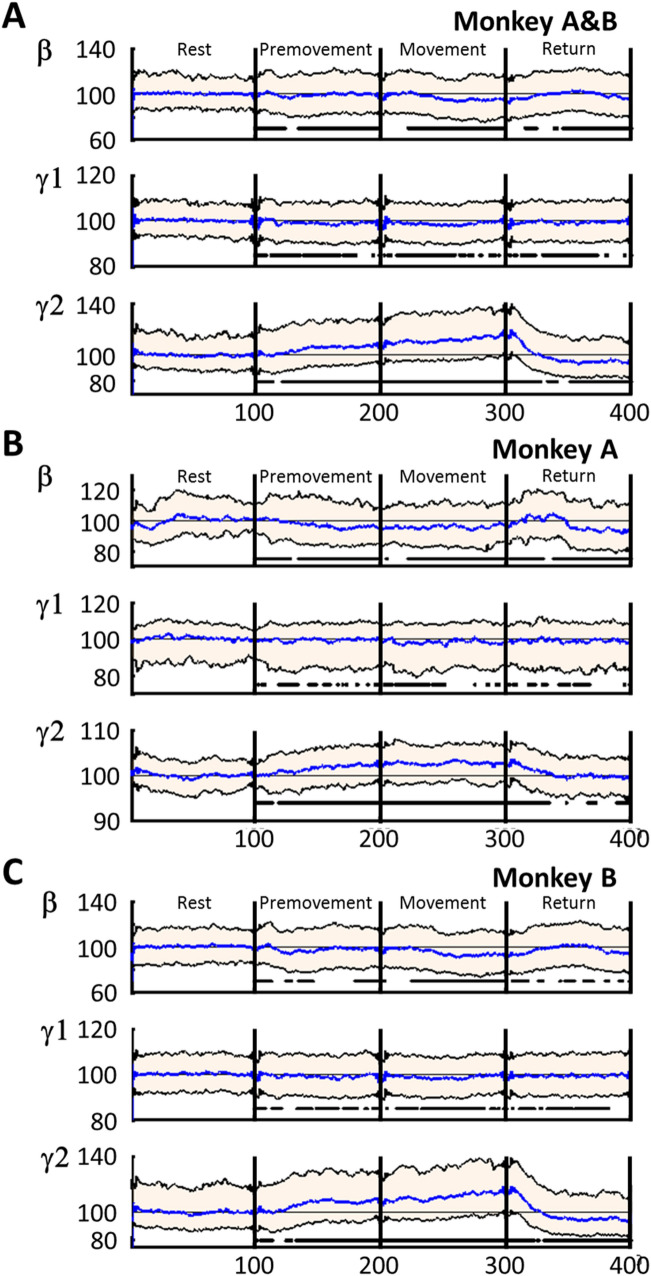
Figure 4.
The β (13–30 Hz), γ1 (30–80 Hz), and γ2 (80–200 Hz) band activity changes during motor task periods (Rest, Premovement, Movement, and Return) with DBS-OFF. (A) Monkeys A and B combined. (B) Monkey A. (C) Monkey B. The activity in each band was calculated using the Kalman filter and normalized to the median activity during Rest (% of base line, BL). Time was normalized to 100 time units in each period (total, 400 relative time units). Purple, median; blue, median activity during the Rest period; black borders of pink area, interquartile range (25th to 75th percentiles); horizontal, interrupted thick black lines in the bottom indicate significant differences from the Rest period (P < 0.05).

