
Figure 6.
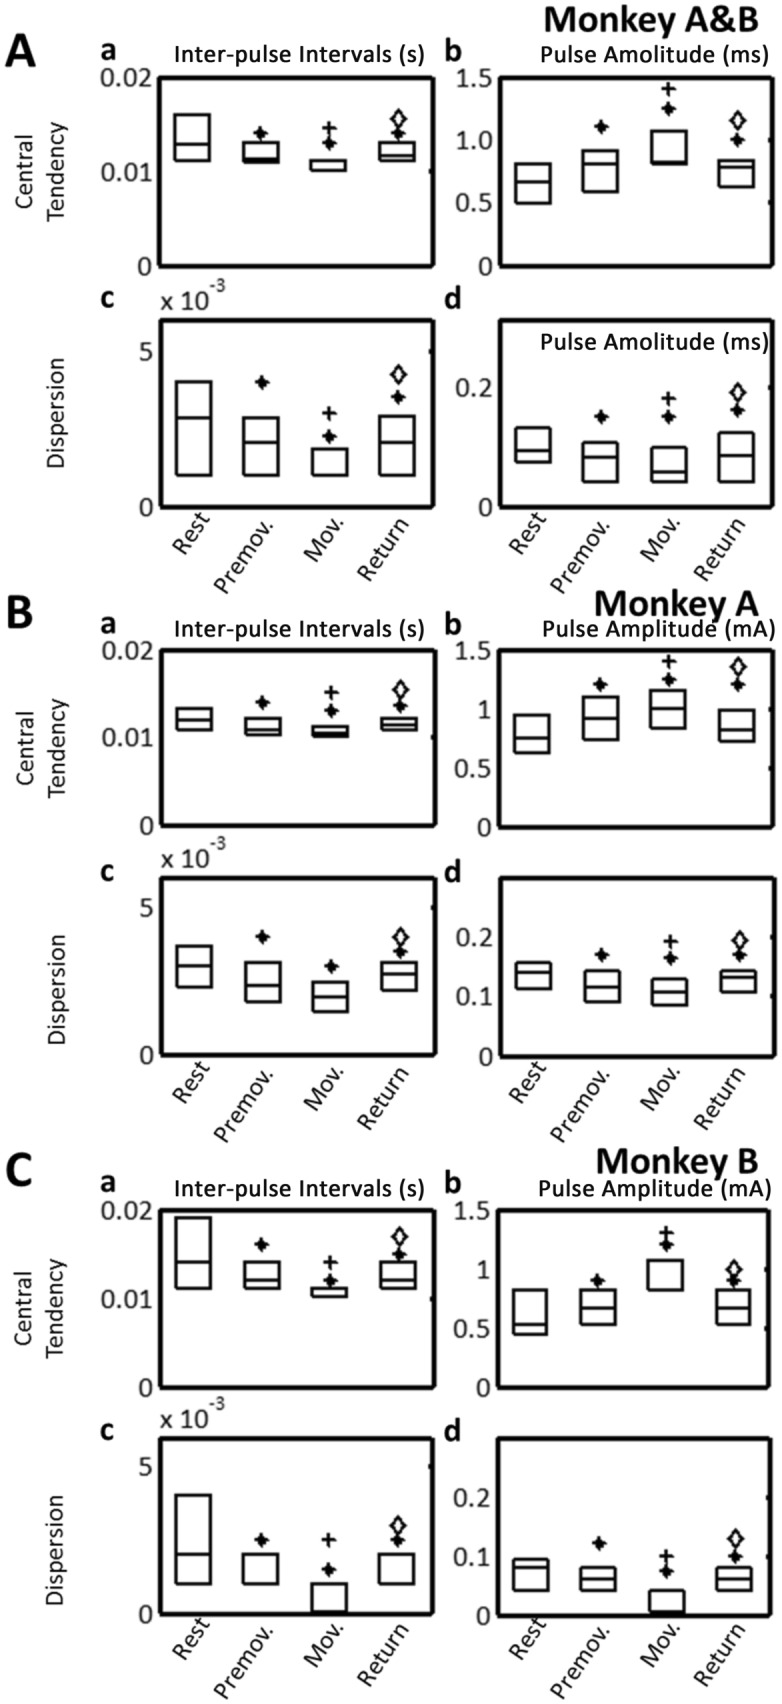
aDBS: central tendency (upper) and dispersion (lower) of stimulus intervals (left) and amplitudes (right) of train stimulation pulses during motor task periods (Rest, Premovement, Movement, and Return). (A) Monkeys A and B combined. (B) Monkey A. (C) Monkey B. Central tendency was estimated by the median; dispersion was estimated by the median absolute deviation. Box plots indicate median and interquartile range (25th-75th percentiles). *P < 0.05, significantly different from Rest; +P < 0.05, significantly different from Premovement; ◊P < 0.05, significantly different from Movement.