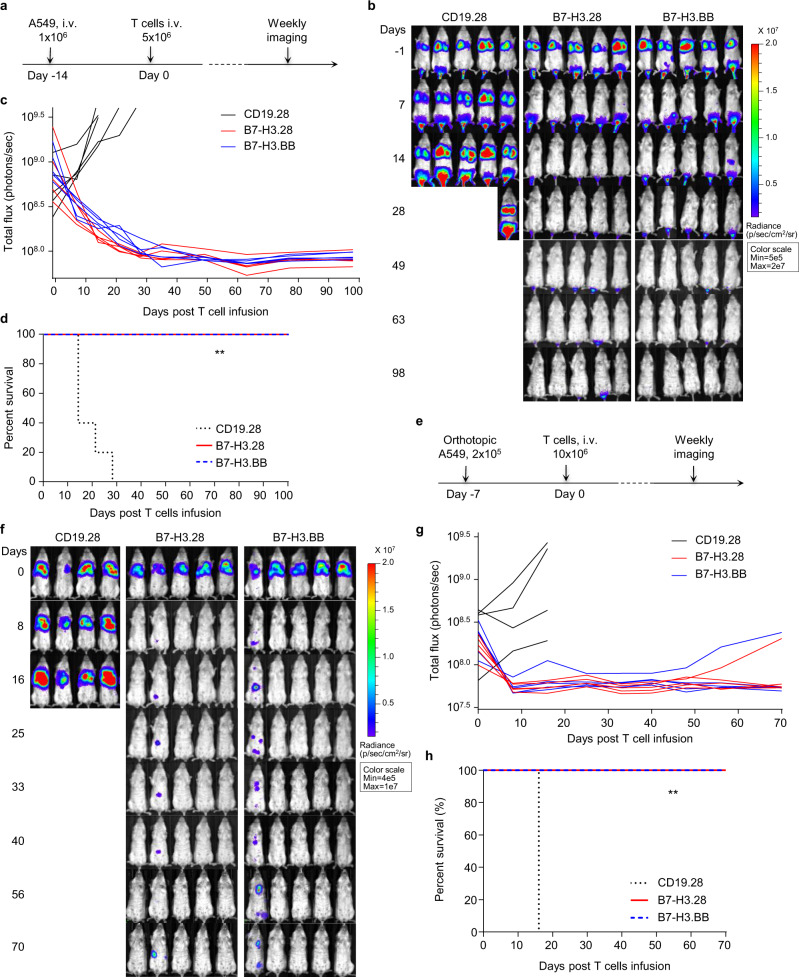
Fig. 2. B7-H3.CAR-T cells eradicate B7-H3+ NSCLC in metastatic and orthotopic models.
a Schematic representation of a metastatic NSCLC model in NSG mice using the FFluc-A549 cell line. Representative images of tumor bioluminescence (BLI) (b) and kinetics (c) of tumor growth (n = 5 mice/group). d Kaplan–Meier survival curve of mice in (b) (n = 5 mice/group), **p = 0.0015 (B7-H3.28 vs. CD19.28 CAR-T cells), **p = 0.0015 (B7-H3.BB vs. CD19.28 CAR-T cells) χ2 test. In this model for the survival curve, mice were censored when the luciferase signal reached 3.5 × 10⁹ photons per second. e Schematic representation of an orthotopic NSCLC model in NSG mice using the FFluc-A549 cell line. Representative images of tumor BLI (f) and kinetics (g) of tumor growth (n = 5 mice/group). h Kaplan–Meier survival curve of mice in (e) (n = 5 mice/group), **p = 0.0047 (B7-H3.28 vs. CD19.28 CAR-T cells), **p = 0.0047 (B7-H3.BB vs. CD19.28 CAR-T cells) χ2 test. In this model for the survival curve, mice were censored when the luciferase signal reached 3.5 × 10⁹ photons per second. Days indicated in (b and f) are days post T cell infusion. Source data for (c, d, g, h) are provided as a Source Data file.

