
Figure 1.
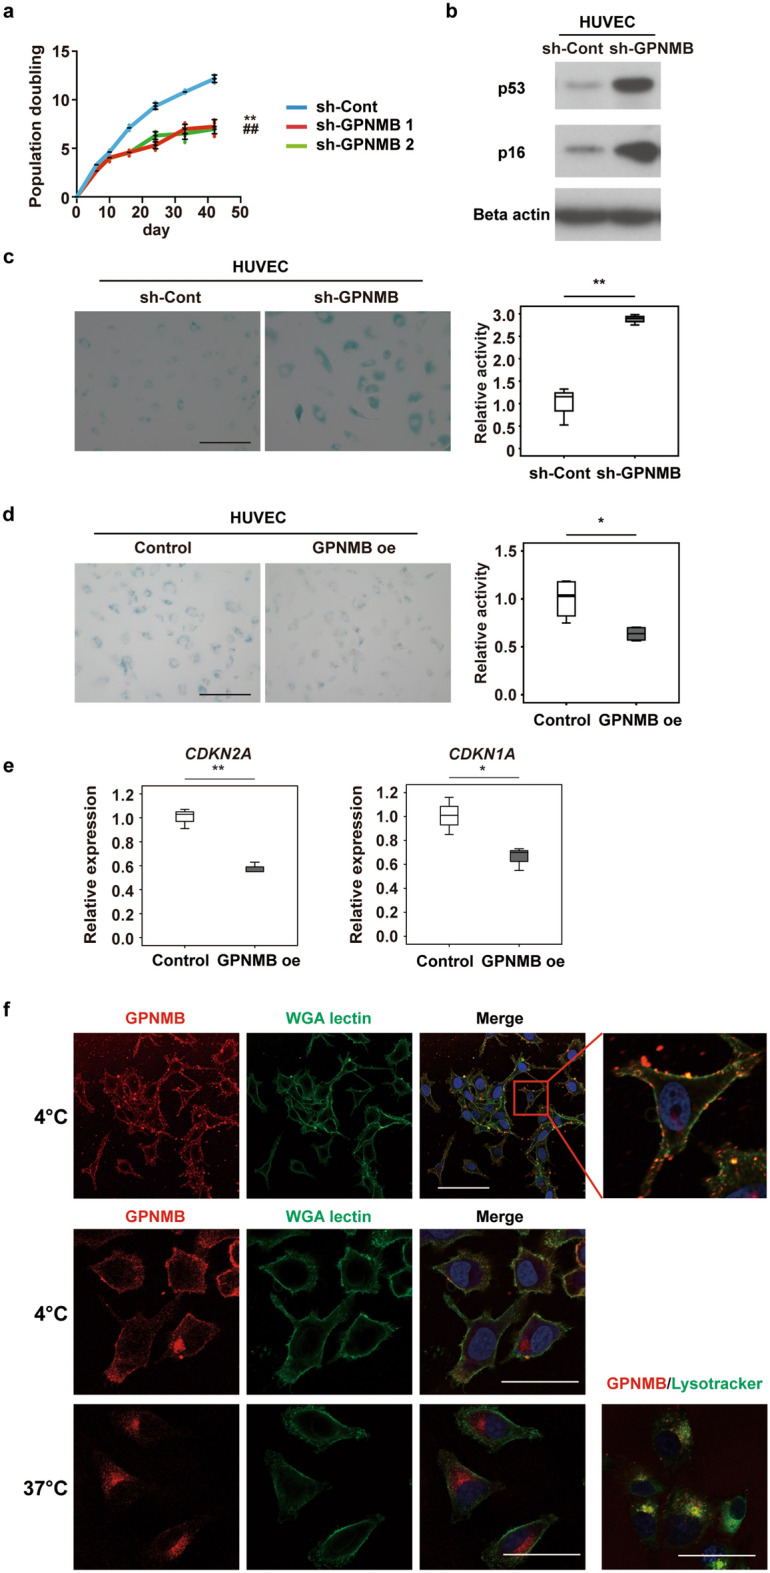
GPNMB positively regulates cellular lifespan. (a) Replicative lifespan of HUVECs infected with a retroviral vector expressing shRNAs targeting GPNMB (sh-GPNMB1 or sh-GPNMB2) or a control vector (sh-Cont). Infected cells were passaged until the termination of replication and the number of population doublings was determined (n = 3 for sh-Cont, n = 4 for sh-GPNMB1, and n = 4 for sh-GPNMB2). **P < 0.01, sh-Cont vs. sh-GPNMB1; ##P < 0.01, sh-Cont vs. sh-GPNMB2. (b) Western blot analysis of p53 and p16 expression by HUVECs infected with a retroviral vector expressing shRNA for GPNMB (sh-GPNMB) or a control vector (sh-Cont). Original blots are presented in Supplementary Fig. 6. (c) SA-β-gal assay of HUVECs infected with a retroviral vector expressing shRNA for GPNMB (sh-GPNMB) or a control vector (sh-Cont) at passage 7. Representative photomicrographs are shown at × 200 magnification. Scale bar = 200 μm. The right graph displays quantification of SA-β-gal activity (n = 3 each). (d,e) SA-β-gal assay and PCR analysis of doxorubicin-induced senescent HUVECs infected with a GPNMB overexpression vector (GPNMB oe) or a control vector (Control) ((d) n = 4 for each; e, n = 3 for each). Representative photomicrographs are shown. Scale bar = 200 μm. The graphs display quantification of SA-β-gal activity (d) and expression of senescence makers (e). (f) Immunostaining for GPNMB in SK-MEL-2 at 4 °C and 37 °C. Plasma membrane was stained with WGA lectin (green), nuclei were labeled with Hoechst (blue), and lysosomes were labeled with Lysotracker (green). Scale bar (upper panel) = 100 μm. Scale bar (middle and lower panels) = 50 μm. The data were analyzed by repeated measures analysis followed by Tukey’s multiple comparison test (a) or by the two-tailed Student’s t test (c–e). *P < 0.05, **P < 0.01. The data are shown as the mean ± SD with plots of all individual data (a) or box and whisker plots (c–e).