Figure 4.
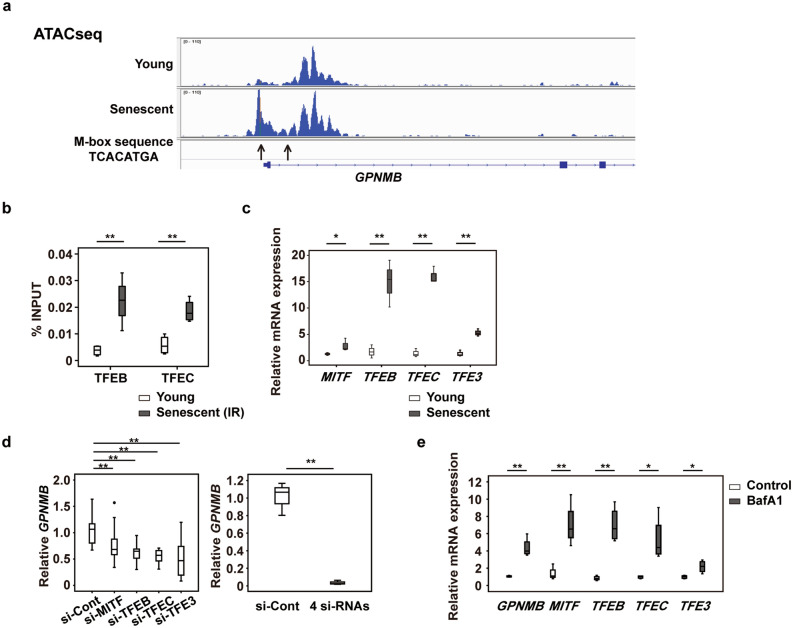
GPNMB expression is upregulated by lysosomal stress. (a) ATAC-seq of HUVECs. (b) ChIP-qPCR analysis of TFEB and TFEC transcription factors in young HUVECs and irradiation-induced senescent HUVECs (n = 4 each). The 10% of sonicated sample was used as an input control. The ratio of precipitated chromatin (%INPUT) was calculated as follows: %INPUT = 2(Ct (INPUT) – log210 – Ct (IP))*100. (c) Relative expression of the MITF/TFE transcription factors in young and replicative senescent HUVECs examined by qPCR (n = 3 each). (d) The left graph displays relative expression of GPNMB in replicative senescent HUVECs after introduction of siRNAs for the MITF/TFE transcription factors (si-MITF, si-TFEB, si-TFEC, and si-TFE3) or control siRNA (si-Cont) (n = 6 for si-Cont, n = 8 for si-MITF, n = 8 for si-TFEB, n = 8 for si-TFEC, and n = 8 for si-TFE3). Two outliers (○) were detected in the si-MITF and si-TFEB group by boxplot analysis and were excluded from statistical analysis. The right graph displays relative expression of GPNMB after introduction of a mixture of 4 siRNAs (si-MITF, si-TFEB, si-TFEC, and si-TFE3) or control siRNA (si-Cont). (n = 3 each). e, qPCR showing relative expression of GPNMB and the transcription factors MITF/TFEs in HUVECs treated for 24 h with 100 nmol l–1 bafilomycin A1 (BafA1, n = 4) or the vehicle (Control, n = 4). The data were analyzed by the two-tailed Student’s t test (b–e), or by one-way ANOVA followed by Tukey’s multiple comparison test (d). *P < 0.05, **P < 0.01. The data are shown as box and whisker plots (b–e).

