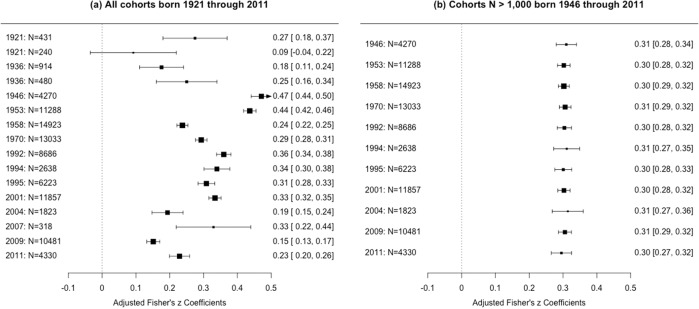
Fig. 2. Forest plots of adjusted Fisher’s z-transformed correlations between family SES and children’s school performance over 95 and 70 years.
Note. Cohorts are ordered by their average year of birth and shown with their respective sample sizes; Fisher’s z-transformed estimates are in the left column with [95% Confidence Interval]. Correlations were adjusted for cohort-specific confounders, including type of assessment of school performance; number of available indicators for SES and school performance; age of assessment of SES and school performance; cohorts’ geographical scope; and % of missing data. The size of the squares represents the cohort’s sample size. Data from the two cohorts born in 1921 and 1936, respectively, were not merged, because they differed in geographical scope.

