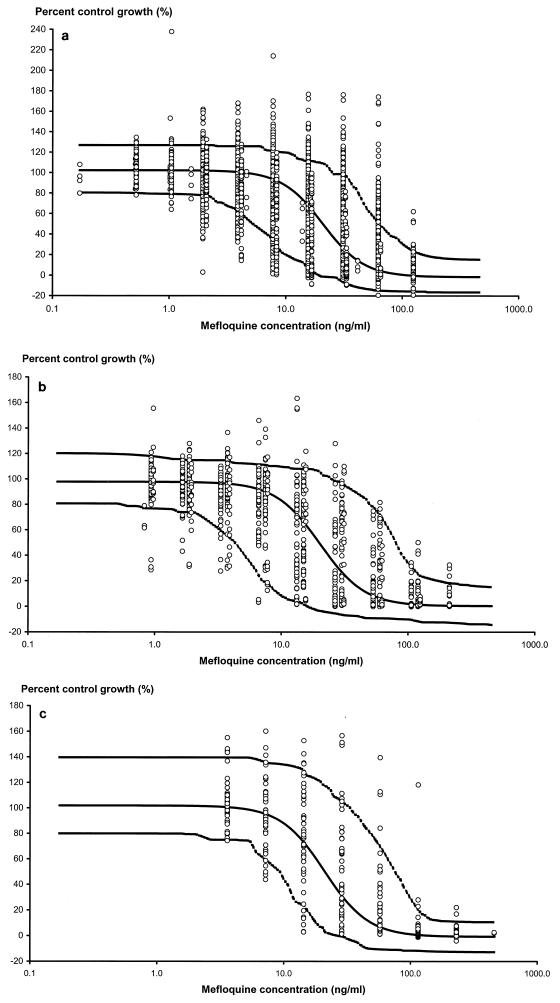
FIG. 1.
Percent uptake of [3H]hypoxanthine compared to that in drug-free control wells for various mefloquine concentrations. The solid line shows the fit of the data and represents the predicted concentration-time profile for the population mean. The outer, dashed lines represent the 90% prediction intervals. The three panels show the fits for the following data sets: U.S. Armed Forces Research Institute of Medical Sciences (a), Wellcome Unit, Bangkok (b), and the Shoklo Malaria Research Unit (c).

