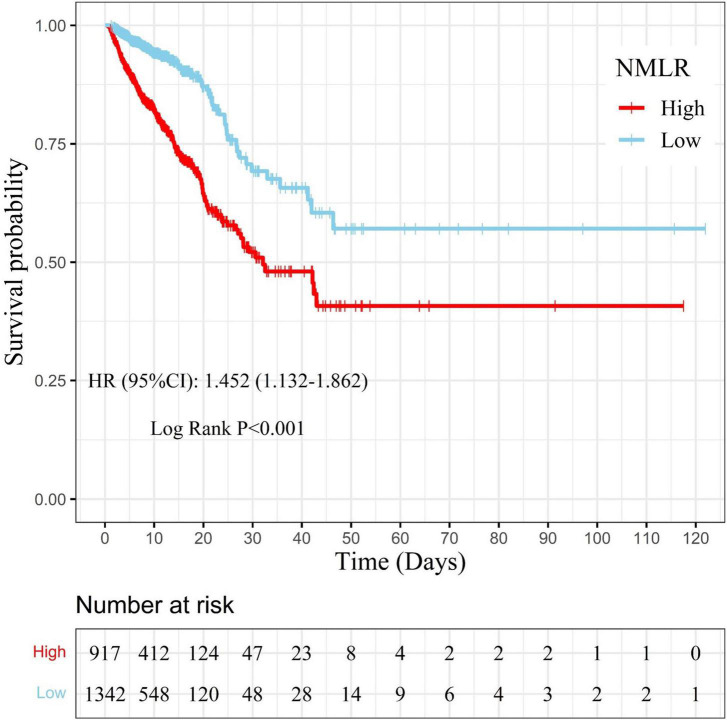
FIGURE 4.
Kaplan–Meier curve for samples with different admission NMLR levels. The survival probability of samples in the high admission NMLR group (NMLR ≥8.518) is indicated by the solid red line, whereas that of samples in the low admission NMLR group (NMLR <8.518) is indicated by the solid blue line. Censors are indicated by “+”. The survival curve in the high admission NMLR group was significantly lower than that in the low admission NMLR group (log-rank test: P < 0.001). After adjusting for cofounders with a P-value <0.05 in multivariate analysis, the Cox regression analysis showed that the high admission NMLR group was associated with an increased risk of in-hospital mortality compared to the low admission NMLR group (HR, 1.452; 95%CI, 1.132–1.862; P = 0.003). NMLR, (neutrophil+monocyte)/lymphocyte ratio; HR, hazard ratio; CI, confidence interval.

