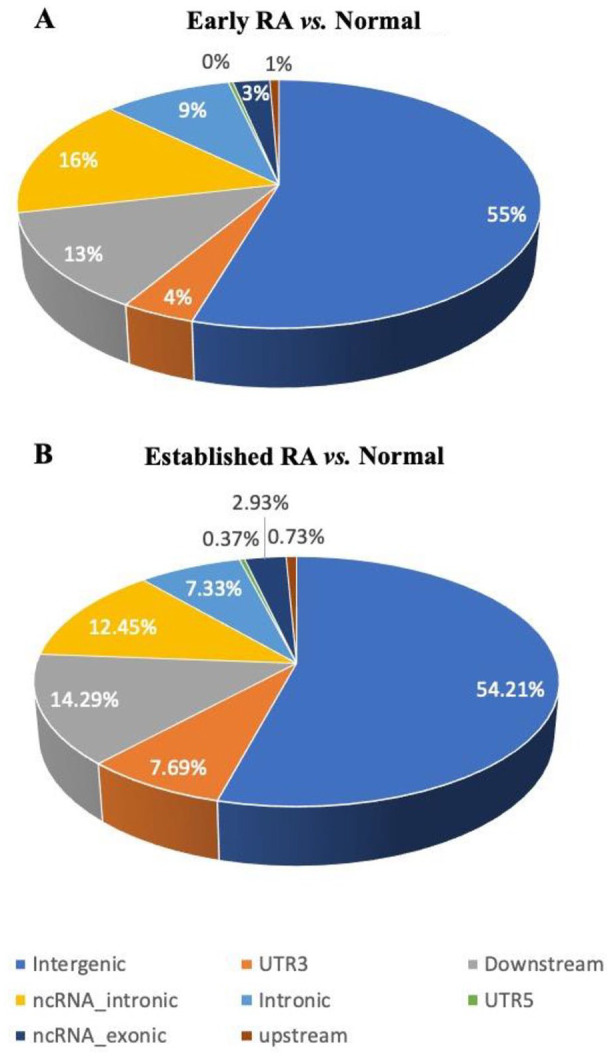
Figure 1.

Genomic distribution of putative RNA editing sites. Pie charts represent the distribution of the identified putative RNA editing sites in different genomic regions. RNA editing events identified using REDItools were annotated using the information in REDIportal database. The percentage of editing events specific to early RA (A) and established RA (B) in the different genomic regions was plotted as pie-charts.
