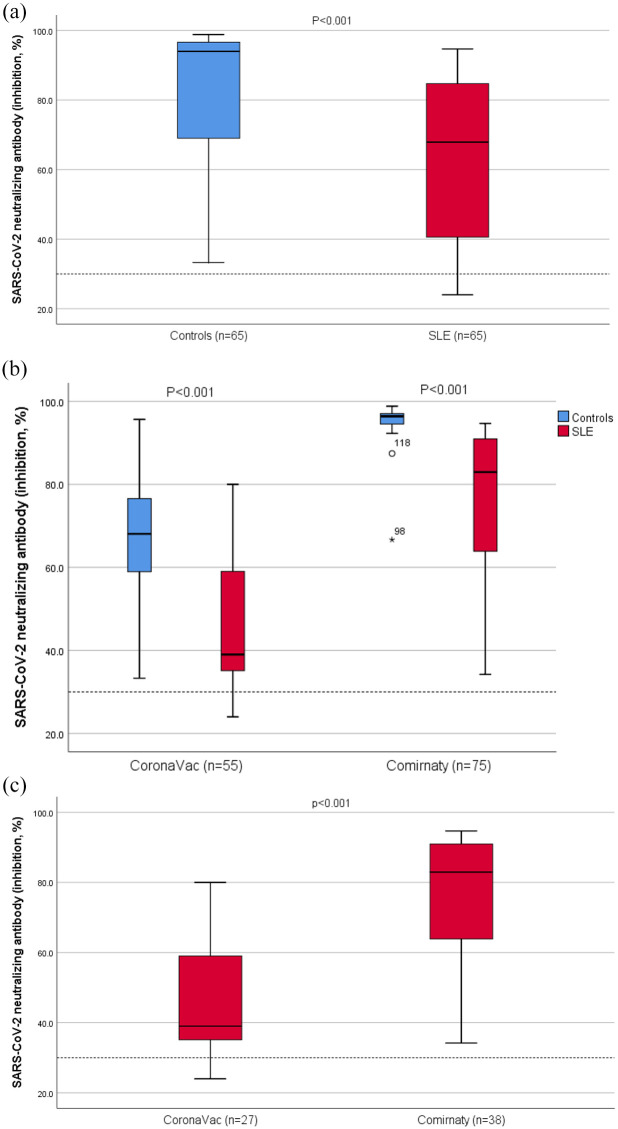
Figure 1.
Distribution of neutralizing antibody levels after COVID-19 vaccines comparing (a) SLE patients and matched controls, (b) SLE patients and matched controls in two vaccine subgroups, and (c) two vaccine types in SLE patients. Data for each group are presented as box plots: central values within boxes correspond to median; the range between the lower (Q1) and upper (Q3) bounds of the boxes is the IQR. Whiskers represent scores outside IQR and end in maximum (higher ‘calculated value’ = Q3 + 1.5 x IQR) and minimum (lower ‘calculated value’ = Q1 – 1.5 x IQR). Spots are outliers above the maximum or under the minimum values. Data regarding were analyzed using Mann–Whitney-U test. Dotted line denotes the cut-off level for positivity (30%).

