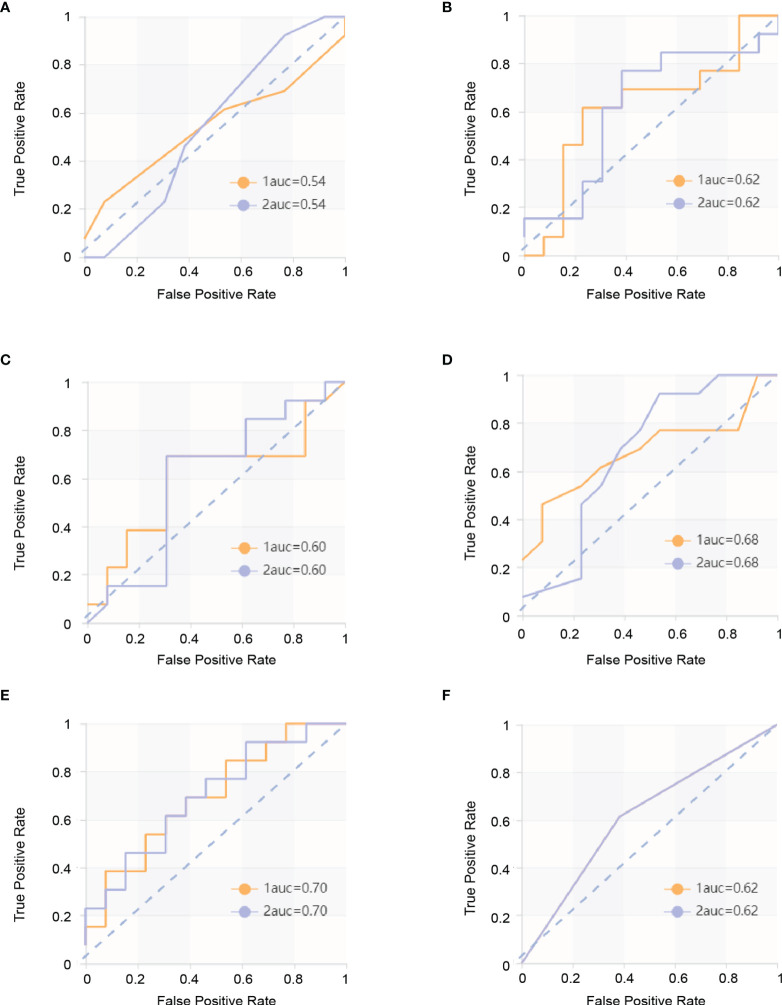
Figure 2.
ROC curves in arterial phase. The yellow curve is the poor prognosis group (PP group), and the blue curve is the good prognosis group (GP group). (A) ROC curve of the KNN model in the validation set. The AUC were 0.544 in the PP group (sensitivity and specificity were 0.46 and 0.62, respectively) and 0.544 in the GP group (sensitivity and specificity were 0.46 and 0.62, respectively). (B) ROC curve of the SVM model in the validation set. The AUC were 0.621 in the PP group (sensitivity and specificity were 0.62 and 0.69, respectively) and 0.621 in the GP group (sensitivity and specificity were 0.69 and 0.62, respectively). (C) ROC curve of the XGBoost model in the validation set. The AUC were 0.601 in the PP group (sensitivity and specificity were 0.69 and 0.38, respectively) and 0.601 in the GP group (sensitivity and specificity were 0.38 and 0.69, respectively). (D) ROC curve of RF model in the validation set. The AUC were 0.680 in the PP group (sensitivity and specificity were 0.62 and 0.69, respectively) and 0.680 in the GP group (sensitivity and specificity were 0.69 and 0.62, respectively). (E) ROC curve of the LR model in the validation set. The AUC were 0.698 in the PP group (sensitivity and specificity were 0.62 and 0.62, respectively) and 0.698 in the GP group (sensitivity and specificity were 0.62 and 0.62, respectively). (F) ROC curve of the DT model in the validation set and ROC curve of the validation set. The AUC were 0.615 in the PP group (sensitivity and specificity were 0.62 and 0.62, respectively) and 0.615 in the GP group (sensitivity and specificity were 0.62 and 0.62, respectively).

