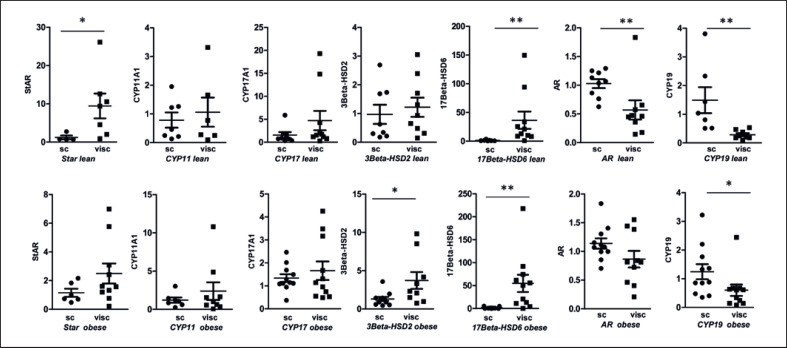
Fig. 2.
Depot-specific differences of relative gene expression of steroidogenic enzymes. RPLP0 was used as a reference gene. First row represents depot-specific differences in lean women and second row in obese women. Sc and visc AT are compared and results are expressed as dot blots plus mean ± SEM. N = 6–10 samples in each group. The different degrees of significance was indicated as follows in the graphs *p < 0.05; **p < 0.01.

