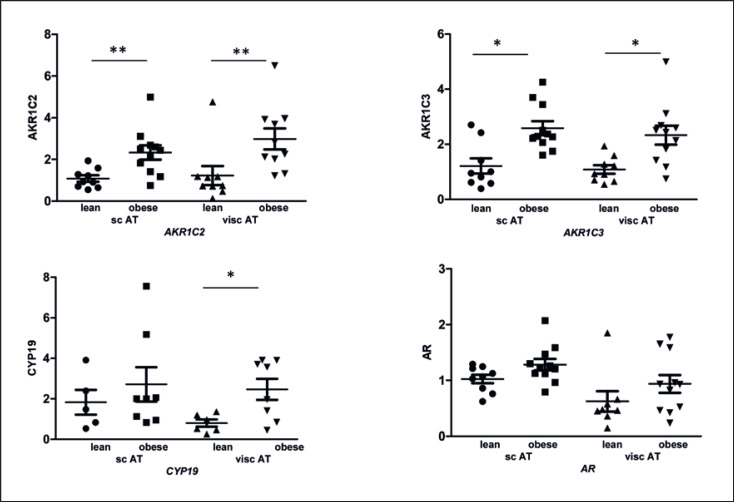
Fig. 3.
Relative gene expression level of steroidogenic enzymes always compared to AT of sc depots of lean women. Differences of expression of lean and obese females and from both depots are depicted. RPLP0 was used as a reference gene. Results are expressed as dot blots plus mean ± SEM from 10 samples per group. The different degrees of significance was indicated as follows in the graphs *p < 0.05; **p < 0.01.

