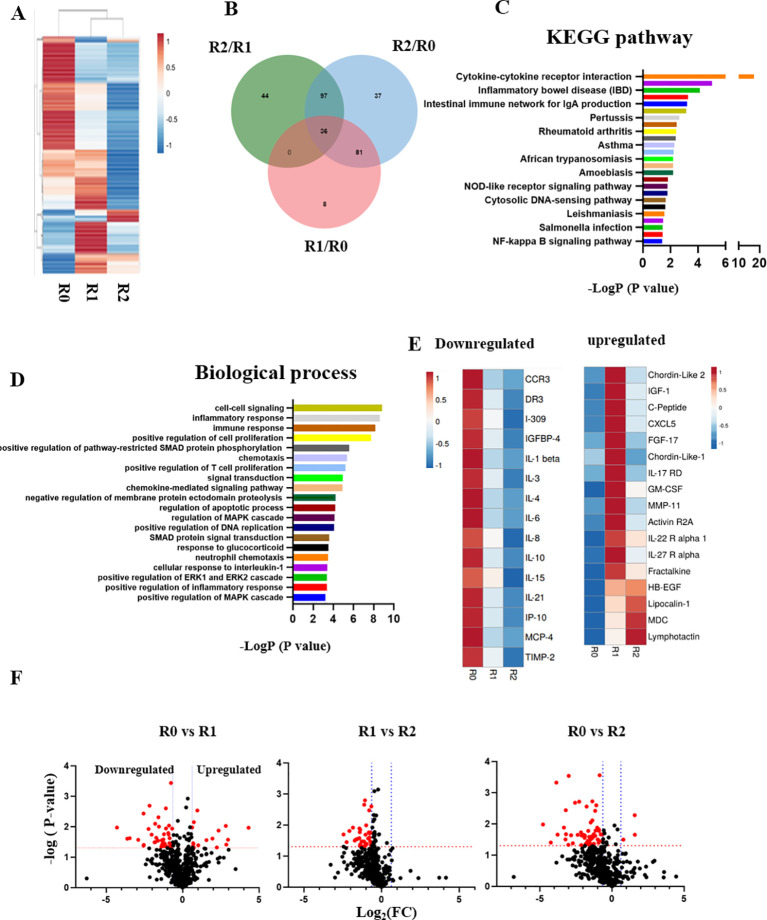
Figure 3. The longitudinal profiling of serum proteome after rounds of TPE.
A. Comparative heat mapping of 507 proteins between TPE rounds was done on RayBiotech Array. B. Venn diagram showing the overlap between the proteins, which were influenced by the TPE rounds. 36 shared proteins were diminished each TPE round (0.65> Fold change). C. The KEGG signaling pathway analysis. D. The top 20 list of biological processes. E. Heat mapping of the proteins that relate to Aging and Inflammaging and are decreased by TPE. F. Volcano plots of proteomics as per TPE rounds. More proteins are downregulated by the second round than by the first. The red dots represent differently expressed proteins ( P < 0.05; |Log 2FC|<1.5), while the grey dots represent proteins with P > 0.05.

