FIGURE 2.
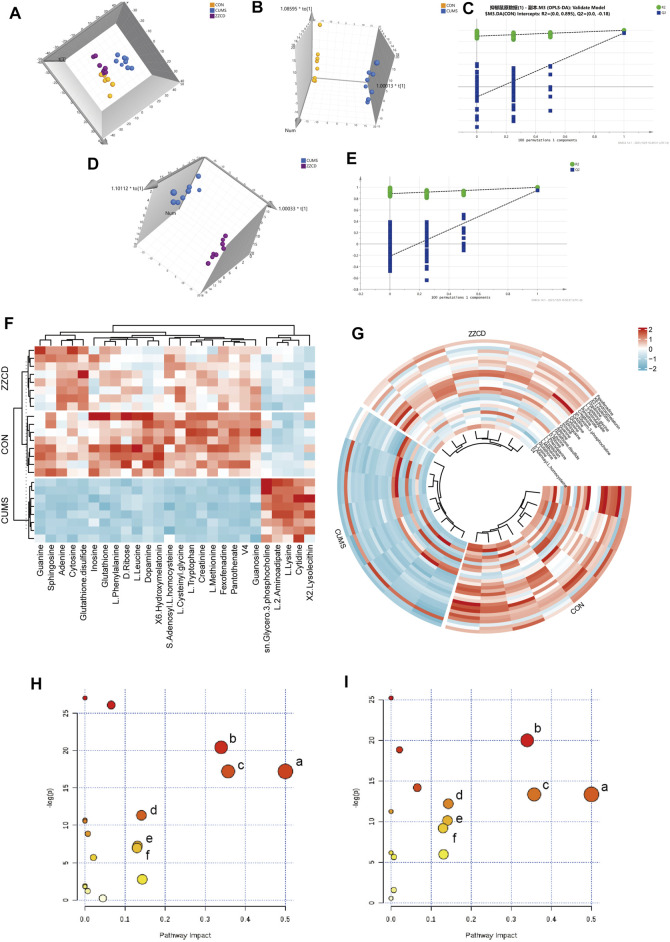
Multi-variate data analysis results. PCA scores plot of CON (yellow), CUMS (blue) and ZZCD (purple) group (A), OPLS-DA scores plot of CON (yellow) and CUMS (blue) group (B), Validation plot of CON and CUMS group by permutation tests (C), OPLS-DA scores plot of CUMS (blue) and ZZCD (purple) group (D), Validation plot of CUMS and ZZCD group by permutation tests (E). Hierarchical clustering heat-map of the 26 differential metabolites (F,G). Metabolic pathway analysis of CON vs. CUMS group, Phenylalanine, tyrosine and tryptophan biosynthesis (a), Glutathione metabolism (b), Phenylalanine metabolism (c), Lysine degradation (d), Cysteine and methionine metabolism (e), Tyrosine metabolism (f) (H) Metabolic pathway analysis of CUMS vs. ZZCD group, Phenylalanine, tyrosine and tryptophan biosynthesis (a), Glutathione metabolism (b), Phenylalanine metabolism (c), Tryptophan metabolism (d), Lysine degradation (e), Tyrosine metabolism (f) (I).

