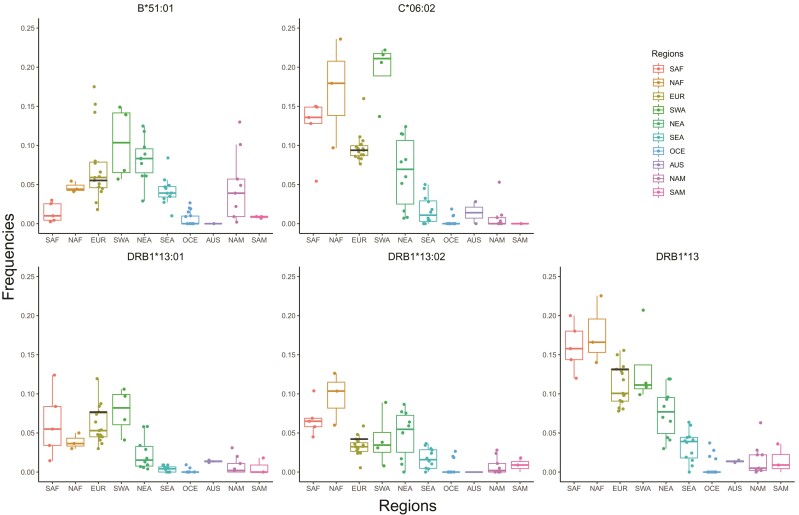
Fig. 1.
Box plots representing frequency distributions of four HLA alleles, B*51:01, C*06:02, DRB1*13:01, and DRB1*13:02, and one allele family, DRB1*13, in each of 10 geographic regions (SAF, Sub-Saharan Africa; NAF, North Africa; EUR, Europe; SWA, South-West Asia; NEA, North-East Asia; SEA, South-East Asia; OCE, Oceania; AUS, Australia; NAM, North America; SAM, South America). The frequencies in a German sample are marked by a black bar, whereas the dots represent the frequencies of these alleles observed in all other populations, as reported in supplementary table S2, Supplementary Material online.

