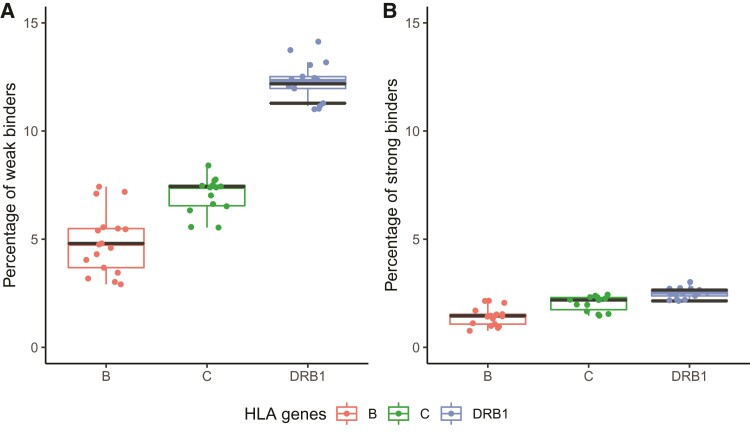
Fig. 2.
Box plots representing the percentages of (A) weak binders and (B) strong binders, among all peptides derived from a total of 3,915 distinct proteins of Yersinia pestis proteome, predicted by netMHCpan and netMHCIIpan for HLA-B, HLA-C, and HLA-DRB1 molecules, with values for B*51:01, C*06:02, DRB1*13:01 (lower bar), and DRB1*13:02 (upper bar) alleles highlighted by black bars. The dots represent the percentages for the other HLA molecules, as reported in supplementary table S3, Supplementary Material online.

