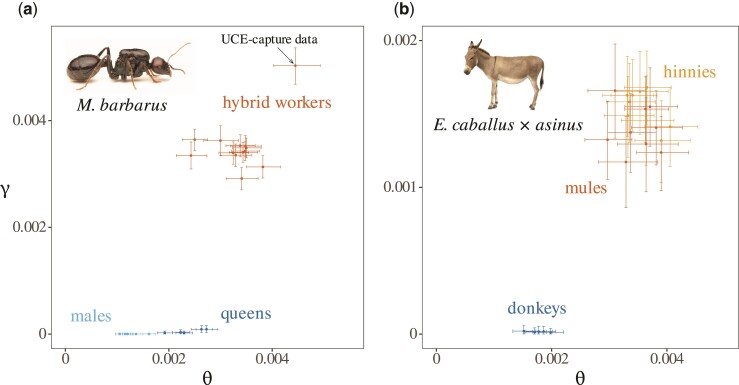
Fig. 3.
Discrimination of F1 hybrids in transcriptomes of M. barbarus and Equus. Estimated values for the divergence parameter and the ancestral population mutation rate are represented for M. barbarus (a) and Equus (b). Colored points and lines represent point estimates and confidence intervals, respectively. Values obtained using UCE-capture data for a single worker of M. barbarus (genbank:SRR5437981) were added for comparison (arrow in panel a).

