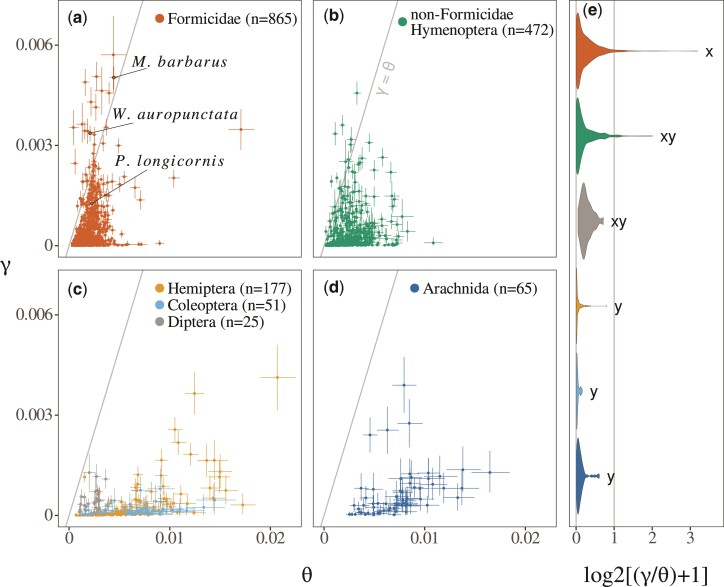
Fig. 4.
Genomic scans for hybridization in six groups of arthropods. Estimates of the divergence parameter and the ancestral population mutation rate are represented for Formicidae (a), NonFormicidae Hymenoptera (b), other insects (c), and Arachnida (d). Colored points and lines represent bayesian point estimates and credibility intervals (see main text), respectively. (e) Distribution of the ratio in each group. A one-shifted -scale, under which the critical value of is unchanged, was used for visual convenience. Letters summarize the result of a post-hoc Tukey honest significance test, carried out using the HSD.test function of the R package agricolae. Groups with no letters in common have significantly different means (with ). All results were obtained using only dated and recent samples (see main text).

