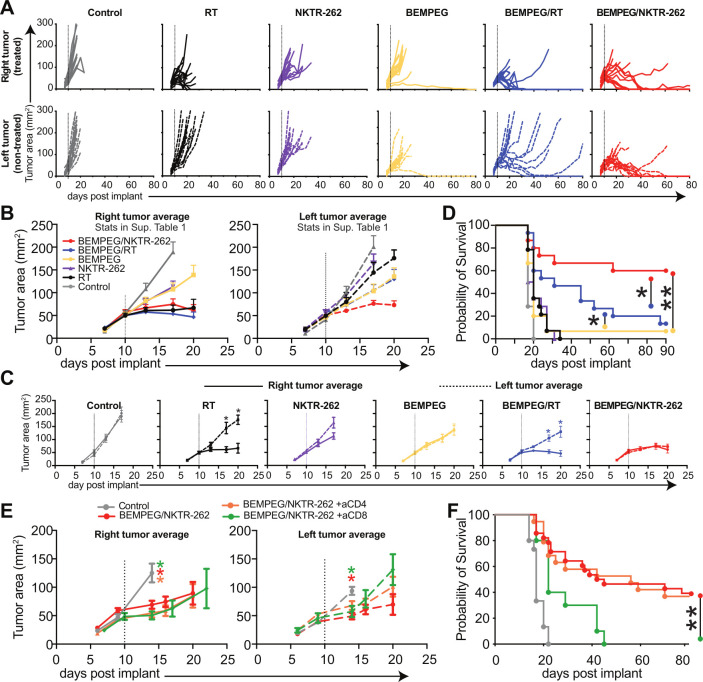
Figure 2.
BEMPEG +NKTR-262 combination therapy significantly reduces tumor growth. (A) CT26 tumor growth depicted for individual animals on the right side (treated) tumor (top row, solid lines), the left side (non-treated) tumor (middle row, dashed lines). (B) Averages for the right and left side tumor growth for each treatment group (; average growth curve lines end after first mouse in the group reached tumor growth cut-off). Dotted line indicates treatment day. Repeated measures ANOVA statistics are presented in online supplemental table 1. (C) Average tumor growth from right (solid line) and left (dotted line) tumors for each group. Statistics indicate comparisons between the right and left tumors within each group. Repeated measures ANOVA. (D) Probability of survival for BEMPEG +NKTR-262 (red), BEMPEG +RT (blue), BEMPEG (yellow), NKTR-262 (purple triangle), RT (black circle), and control (gray). Log-rank test. For A–D, N=14 or 15 from two independent experiments. *P<0.05, **p<0.01. (E) Average CT26 tumor growth after BEMPEG +NKTR-262 therapy in the absence of CD8+ T cells (green) or CD4+ T cells (orange). Repeated measures ANOVA, colored asterisks indicate group that is different from control. (F) Probability of survival for control (gray), BEMPEG +NKTR-262 (red), BEMPEG +NKTR-262+aCD8 (green), and BEMPEG +NKTR-262+aCD4 (orange). **P<0.01, log-rank test. For (E, F), N=10–20 from two independent experiments. ANOVA, analysis of variance; RT, radiation therapy.

