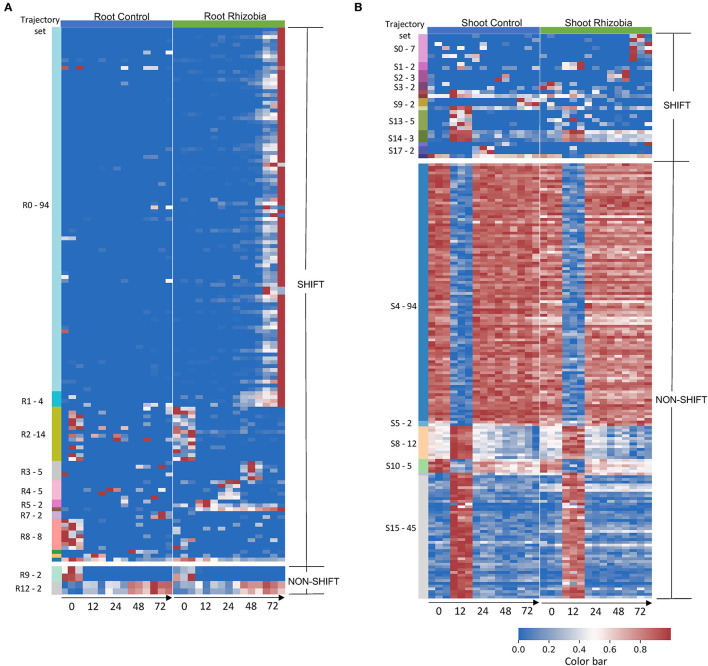
Figure 3.
Gene expression profile in root and shoot of control and rhizobia-infected Medicago plants over 72 h. (A) Heatmap of 142 root genes and (B). Heatmap of 190 shoot genes that GeneShift identified. Data are presented in the heatmap using log2 (x+1) transformed FPKM expression values. Each row represents a gene, and each column represents the expression profile for a single biological sample. The color reference to the left of each heatmap is representing GeneShift trajectory groups (R = root, S = shoot) and the number of genes in that trajectory set. The trajectory sets contain only one gene were not annotated. The numbers below the heatmap represent hours post inoculation (hpi). The color bar represents the relative gene expression in a row.

