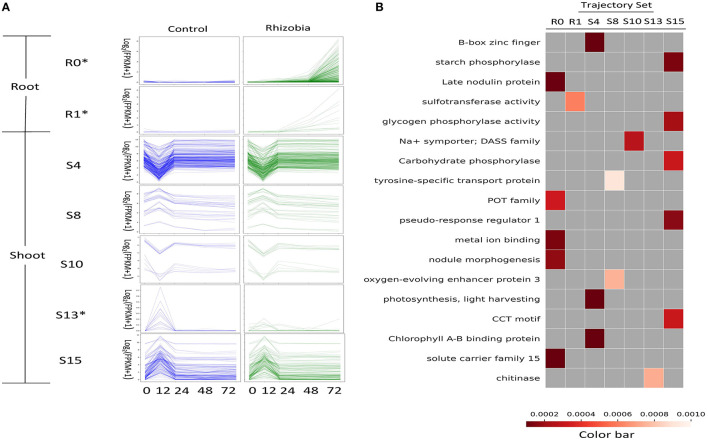
Figure 4.
Functional enrichment of GeneShift output. (A) Expression profiles of several enriched GeneShift trajectory sets corresponding to Figure 3. Control uninoculated is blue, and inoculated with rhizobia is green. The unit of the y-axis is log2 (FPKM+1), and the unit of the x-axis is time (h) after rhizobia inoculation. Each thin line represents one replicate. The asterisk next to the trajectory set name indicates the pattern shifting between two conditions. (B) Gene Ontology, KEGG, fragments per kilobase of gene per million read pairs (FPKM) enrichment analysis of genes assigned to each trajectory set with Benjamini and Hochberg corrected p < 0.001. Each column of the heatmap indicates one trajectory set; each row presents one enriched term.

