Figure 5.
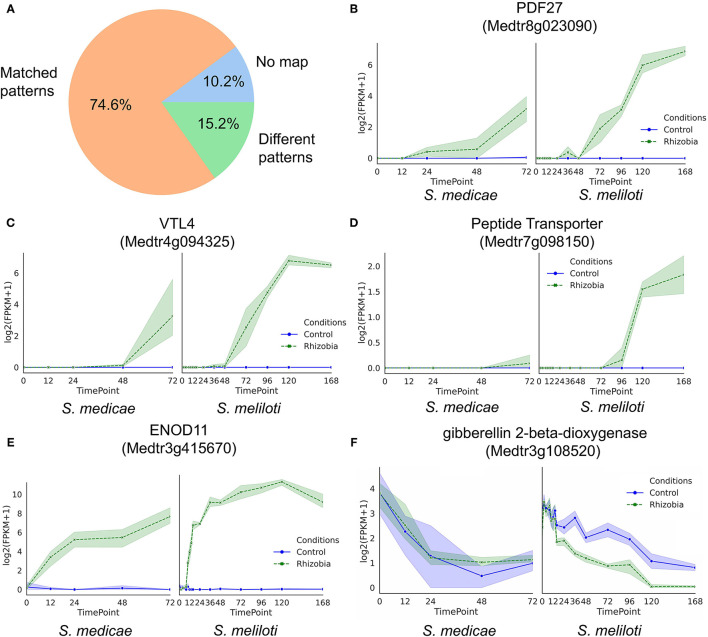
Validation of root time-series expression profiles detected by GeneShift (A) Pie chart of GeneShift detected 118 time-series root DEGs expression profiles from our Sinorhizobium medicae inoculation M.truncatula experiment in comparison to previously published S. meliloti induced M.truncatula transcriptomic data. (B–F) Expression profiles of representative genes in our study S. medicae vs. Schiessl study S.meliloti. Y-axis, log2 (FPKM+1); x-axis, time (h) after rhizobia inoculation, each dot represents mean value of replicates, and shading indicates confidence interval.

